The following table indicates the acoustical power
output which can be expected in two sizes of theaters.
NUMBER OF MODULES
EFFICIENCY
MAXIMUM
ELECTRICAL
POWER INPUT
ACOUSTIC
POWER
SOUND LEVELS
500-
1000-
1000 SEATS 2000 SEATS
1
2%
300 WATTS 6 WATTS
101 dB
100 dB
2
4%
600 WATTS
24 WATTS
107 dB
106 dB
4
8%
1200 WATTS 96 WATTS
113 dB
112 dB
8
16%
2400 WATTS
384 WATTS 119 dB
118 dB
It is essential that only the most stable amplifiers be
used for subwoofer application. The transducers can be
paralleled for 4-ohm operation.
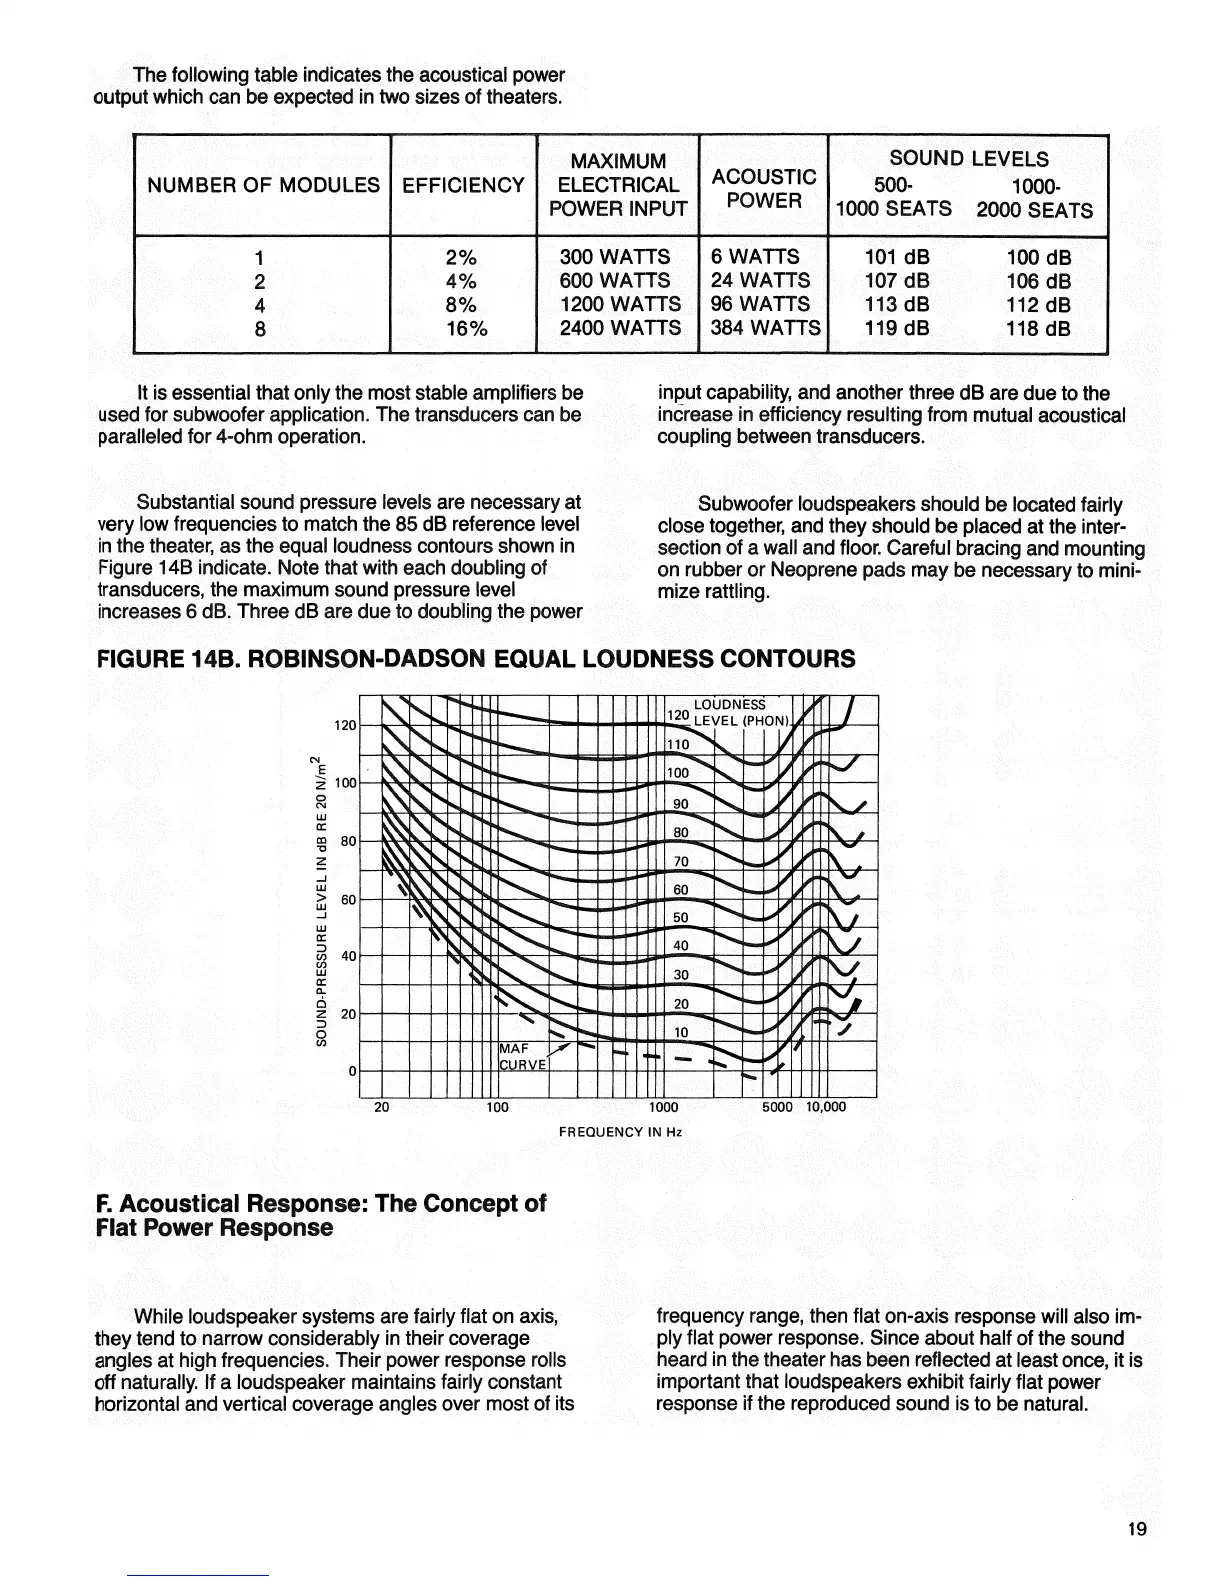
input capability, and another three dB are due to the
increase in efficiency resulting from mutual acoustical
coupling between transducers.
Substantial sound pressure levels are necessary at
very low frequencies to match the 85 dB reference level
in the theater, as the equal loudness contours shown in
Figure 14B indicate. Note that with each doubling of
transducers, the maximum sound pressure level
increases 6 dB. Three dB are due to doubling the power
Subwoofer loudspeakers should be located fairly
close together, and they should be placed at the inter-
section of a wall and floor. Careful bracing and mounting
on rubber or Neoprene pads may be necessary to
mini-
mize rattling.
FIGURE 14B. ROBINSON-DADSON EQUAL LOUDNESS CONTOURS
F. Acoustical Response: The Concept of
Flat Power Response
While loudspeaker systems are fairly flat on axis,
they tend to narrow considerably in their coverage
angles at high frequencies. Their power response rolls
off naturally. If a loudspeaker maintains fairly constant
horizontal and vertical coverage angles over most of its
frequency range, then flat on-axis response will also im-
ply flat power response. Since about half of the sound
heard in the theater has been reflected at least once, it is
important that loudspeakers exhibit fairly flat power
response if the reproduced sound is to be natural.
19
LOUDNESS
LEVEL (PHON)
SOUND-PRESSURE
LEVEL
IN dB RE 20 N/m
2
FREQUENCY IN Hz
MAF
CURVE
 Loading...