11
4.Taking a Measurement
EN
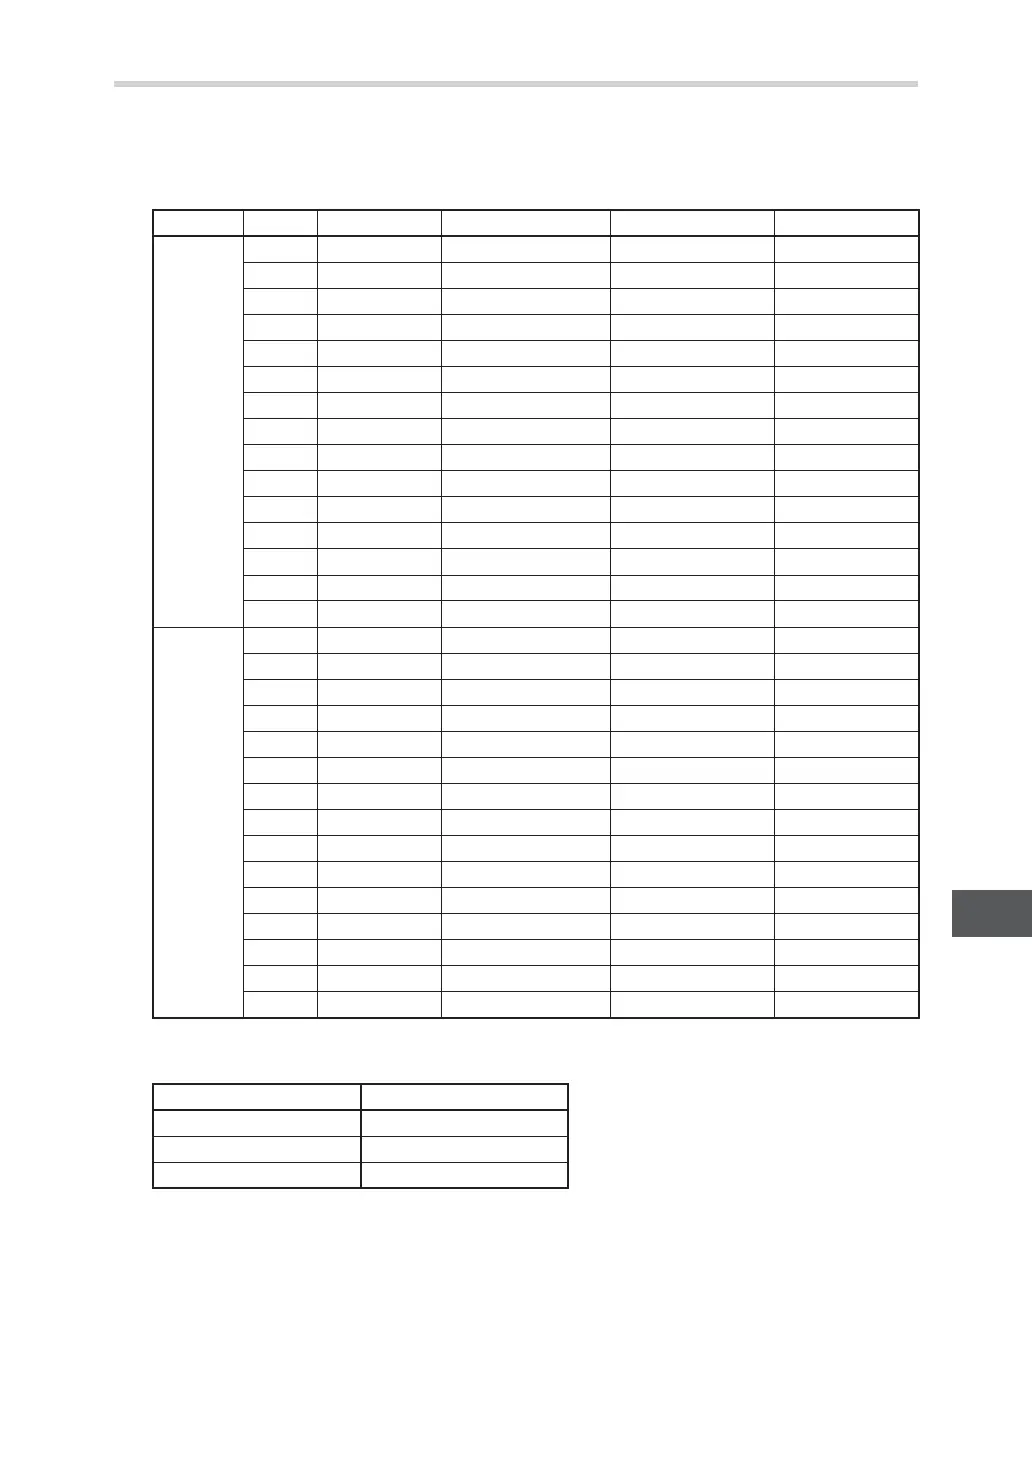
Interpreting the Body Fat Percentage Result
The table below is based on research by HD McCarthy et al, in the International Journal of Obesity, Vol. 30,
2006, and by Gallagher et al., American Journal of Clinical Nutrition, Vol. 72, Sept. 2000, and classified into
four levels by Omron Healthcare.
Interpreting the Visceral Fat Level Result
According to Omron Healthcare figures
Gender Age – (Low) 0 (Normal) + (High) ++ (Very High)
Female
6
< 13.8% 13.8 - 24.9% 25.0 - 27.0%
27.1%
7
< 14.4% 14.4 - 27.0% 27.1 - 29.6%
29.7%
8
< 15.1% 15.1 - 29.1% 29.2 - 31.9%
32.0%
9
< 15.8% 15.8 - 30.8% 30.9 - 33.8%
33.9%
10
< 16.1% 16.1 - 32.2% 32.3 - 35.2%
35.3%
11
< 16.3% 16.3 - 33.1% 33.2 - 36.0%
36.1%
12
< 16.4% 16.4 - 33.5% 33.6 - 36.3%
36.4%
13
< 16.4% 16.4 - 33.8% 33.9 - 36.5%
36.6%
14
< 16.3% 16.3 - 34.0% 34.1 - 36.7%
36.8%
15
< 16.1% 16.1 - 34.2% 34.3 - 36.9%
37.0%
16
< 15.8% 15.8 - 34.5% 34.6 - 37.1%
37.2%
17
< 15.4% 15.4 - 34.7% 34.8 - 37.3%
37.4%
18 - 39
< 21.0% 21.0 - 32.9% 33.0 - 38.9%
39.0%
40 - 59
< 23.0% 23.0 - 33.9% 34.0 - 39.9%
40.0%
60 - 80
< 24.0% 24.0 - 35.9% 36.0 - 41.9%
42.0%
Male
6
< 11.8% 11.8 - 21.7% 21.8 - 23.7%
23.8%
7
< 12.1% 12.1 - 23.2% 23.3 - 25.5%
25.6%
8
< 12.4% 12.4 - 24.8% 24.9 - 27.7%
27.8%
9
< 12.6% 12.6 - 26.5% 26.6 - 30.0%
30.1%
10
< 12.8% 12.8 - 27.9% 28.0 - 31.8%
31.9%
11
< 12.6% 12.6 - 28.5% 28.6 - 32.6%
32.7%
12
< 12.3% 12.3 - 28.2% 28.3 - 32.4%
32.5%
13
< 11.6% 11.6 - 27.5% 27.6 - 31.3%
31.4%
14
< 11.1% 11.1 - 26.4% 26.5 - 30.0%
30.1%
15
< 10.8% 10.8 - 25.4% 25.5 - 28.7%
28
.8%
16
< 10
.4% 10.4 - 24.7% 24.8 - 27.7%
27.8%
17
< 10.1% 10.1 - 24.2% 24.3 - 26.8%
26.9%
18 - 39
< 8.0% 8.0 - 19.9% 20.0 - 24.9%
25.0%
40 - 59
< 11.0% 11.0 - 21.9% 22.0 - 27.9%
28.0%
60 - 80
< 13.0% 13.0 - 24.9% 25.0 - 29.9%
30.0%
Visceral Fat Level Level Classification
1 - 9
0 (Normal)
10 - 14
+ (High)
15 - 30
++ (Very High)
 Loading...