Chapter 7: Status
Performance
Quantum DXi6900 User’s Guide 180
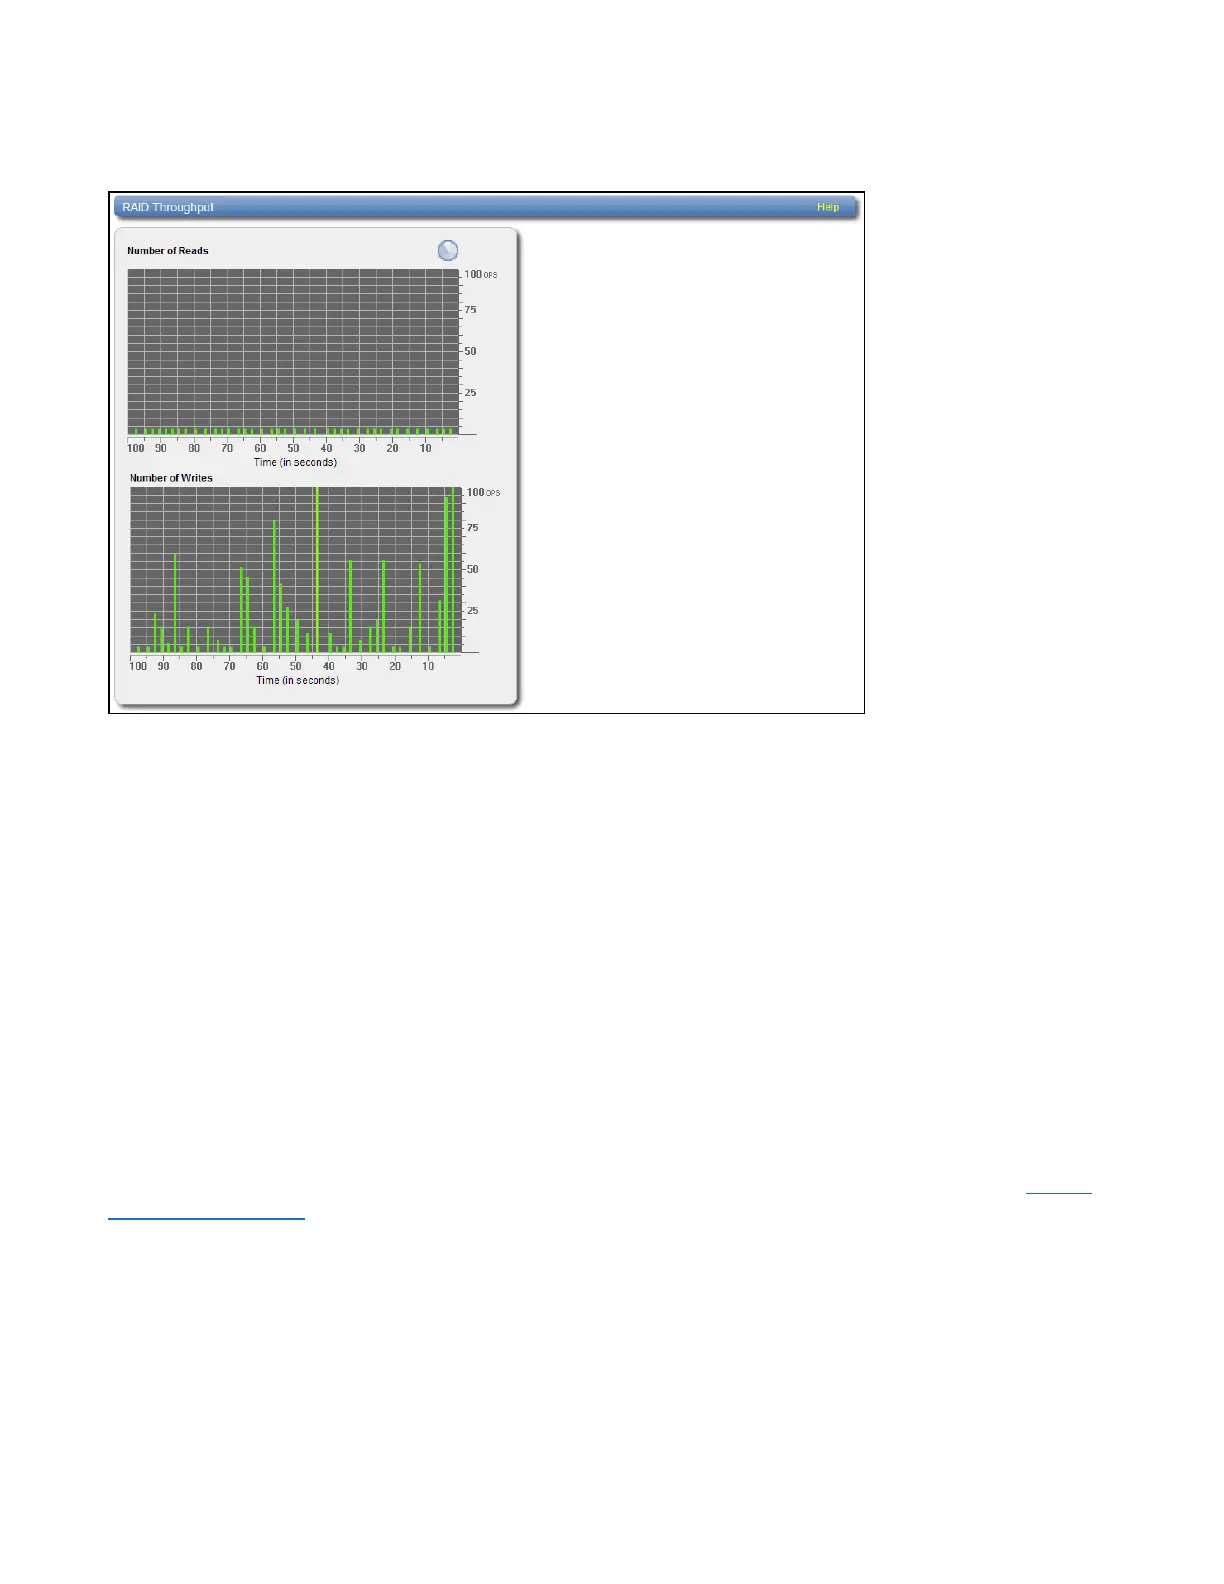
Figure114:RAID Page
Use the RAID page to display recent RAID activity in dynamic graphs:
l The top graph reports data reads and the bottom graph reports data writes.
l The horizontal axis displays time (0–100 seconds).
l The vertical axis displays the amount of data read or written (100 OPS/s).
l Values that exceed the maximum value of the vertical axis are shown in lighter green.
l Each bar on the graph represents approximately 1 second of time.
l Hold the cursor over a bar to display the value of the bar.
Fibre Channel
The FibreChannel page allows you to view throughput performance for Fibre Channel send and receive
activity.
To access the FibreChannel page, on the Performance page, click the FibreChannel tab (see Figure
115 on the next page).
 Loading...