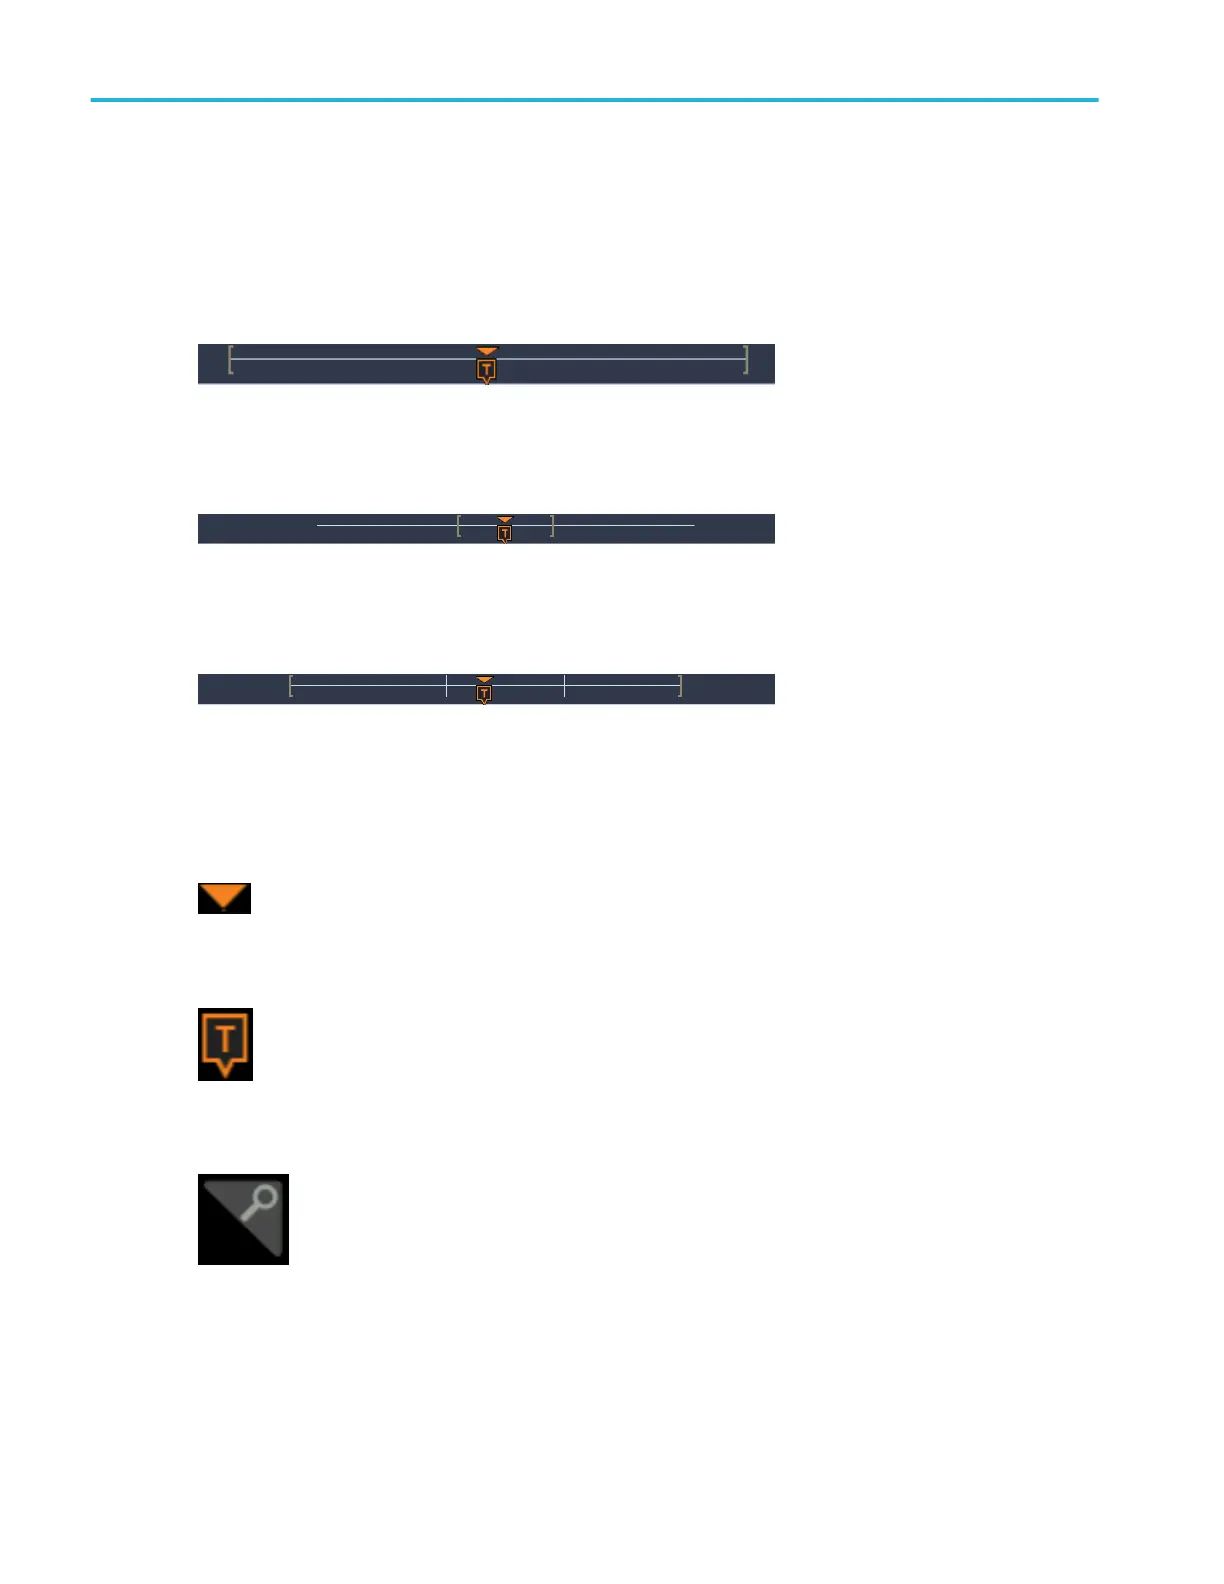
1. The Waveform Record View is a graphical high-level view of the overall acquisition, how much of the acquisition is on the
screen (shown in brackets), the location of key time events including the trigger event, and the current position of waveforms
cursors.
If you are changing the horizontal time scale while the oscilloscope acquisition is stopped, the brackets change position to
show the part of the waveform record that is being viewed relative to the current acquisition total record length.
If cursors are active on a waveform, the Waveform Record View shows the relative cursor positions as small vertical dashed
lines.
When in Zoom mode, the Waveform Record View is replaced with the Zoom Overview. See Zoom user interface elements
on page 28.
2. The Expansion Point icon on the waveform view shows the center point around which the waveform expands and
compresses when changing horizontal settings.
3. The Trigger Position Indicator shows where the trigger event occurred in the waveform record.
4. The Zoom icon (in upper right corner of Waveform and Plot views) toggles zoom on and off.
5. The Trigger Level Indicator icon(s) shows the trigger level(s) on the trigger source waveform. Some trigger types require two
trigger levels.
6. Measurement and Search badges show measurement and search results. See Badges on page 22.
7. The Results Bar Handle opens or closes the Results bar to maximize waveform screen viewing when needed. To reopen
the Results bar, either tap the handle icon or swipe left from the right side of the display.
Getting acquainted with your instrument
18 MDO32, MDO34 Installation and Safety Manual
ООО "Техэнком" Контрольно-измерительные приборы и оборудование www.tehencom.com
 Loading...

