How To Guide
www.tektronix.com/products/video_test/2
Introduction
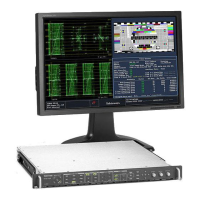
With the introduction of the WFM8300 Tektronix is also introducing two new displays known as the Spearhead (Luma, Saturation
and Value) and the Luminance Qualied Vector (LQV) Display. These new displays do not replace existing displays, but rather
complement the existing displays and are designed to enable even greater precision for high-end Post Production Colorist in the
process of marrying the art and science of color grading.
This tutorial will describe the Spearhead Display and its application in the color grading process.
Note: There is a separate tutorial on using the Luminance Qualied Vector Display.
Why the need for a new display
It’s been said that a good carpenter could build a house with nothing more than a hammer, but you might not want to live in it
and it would probably not have the greatest esthetic appeal.Having the right tool for the job often makes the difference between
a good result and a great result.
Colorists and Graphic Artists have long used Hue Saturation Value (HSL) as a creative tool to enhance photographic and graphic
images. The Vectorscope or Vector display is a popular analysis tool for assessing the color of a video image. However, the
Vector display does not allow the determination of color Saturation or color Value as is sometimes believed. In fact there is no
known Waveform or Vector type XY display in any waveform monitor that directly indicates the color Saturation and Value of the
signal. What is needed is a new display that clearly shows the artistic metrics of Saturation, Value and Lightness combined with
RGB gamut limits allowing a colorist to adjust live signals back into gamut such that the desired image quality is maintained.
Vectorscope Characteristics
The Vectorscope is an XY plot of color (hue) as an angular component of a polar display much like some familiar color wheels
used in color graphics with the signal amplitude represented by the distance from the center (black). It is ideal for monitoring
both hue and amplitude of the chrominance signal.
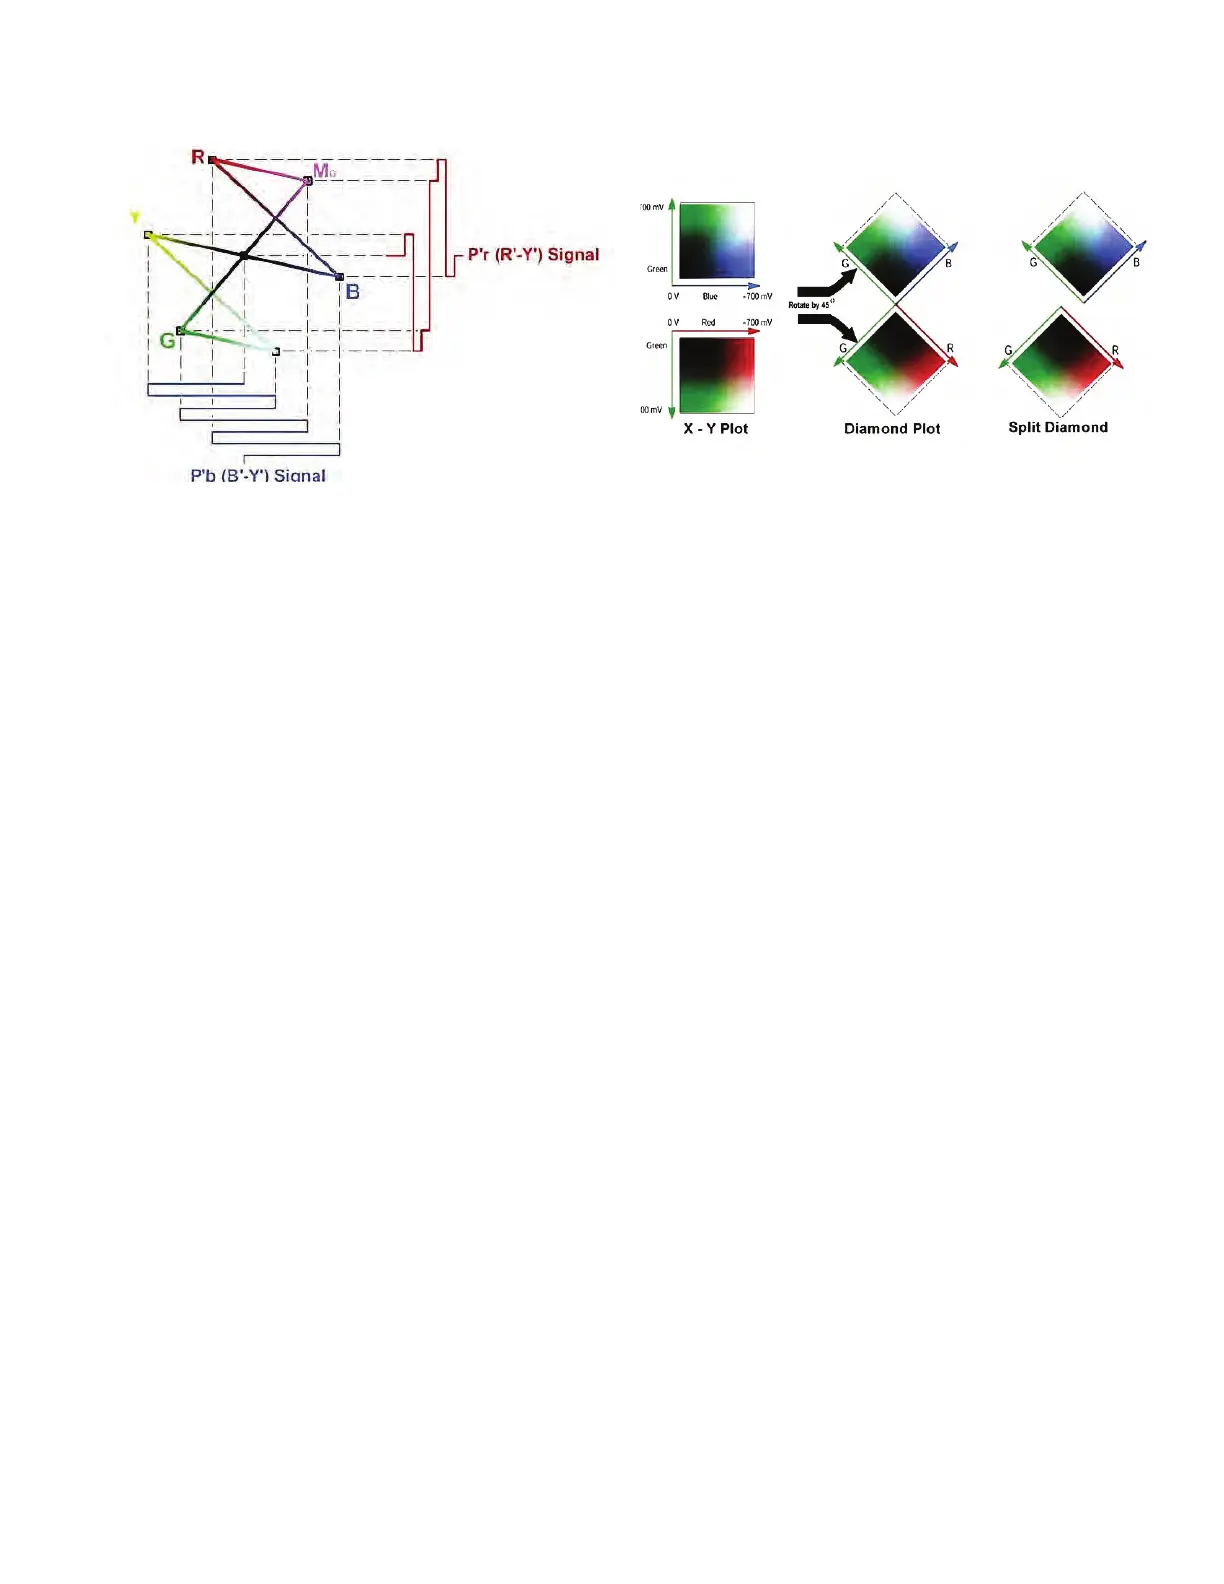
Figure 1. Vector Display. Figure 2. Diamond and Split Diamond Display.
 Loading...


