Performance and curves diagrams
Domestic air conditioner
11.Performence and curves diagrams
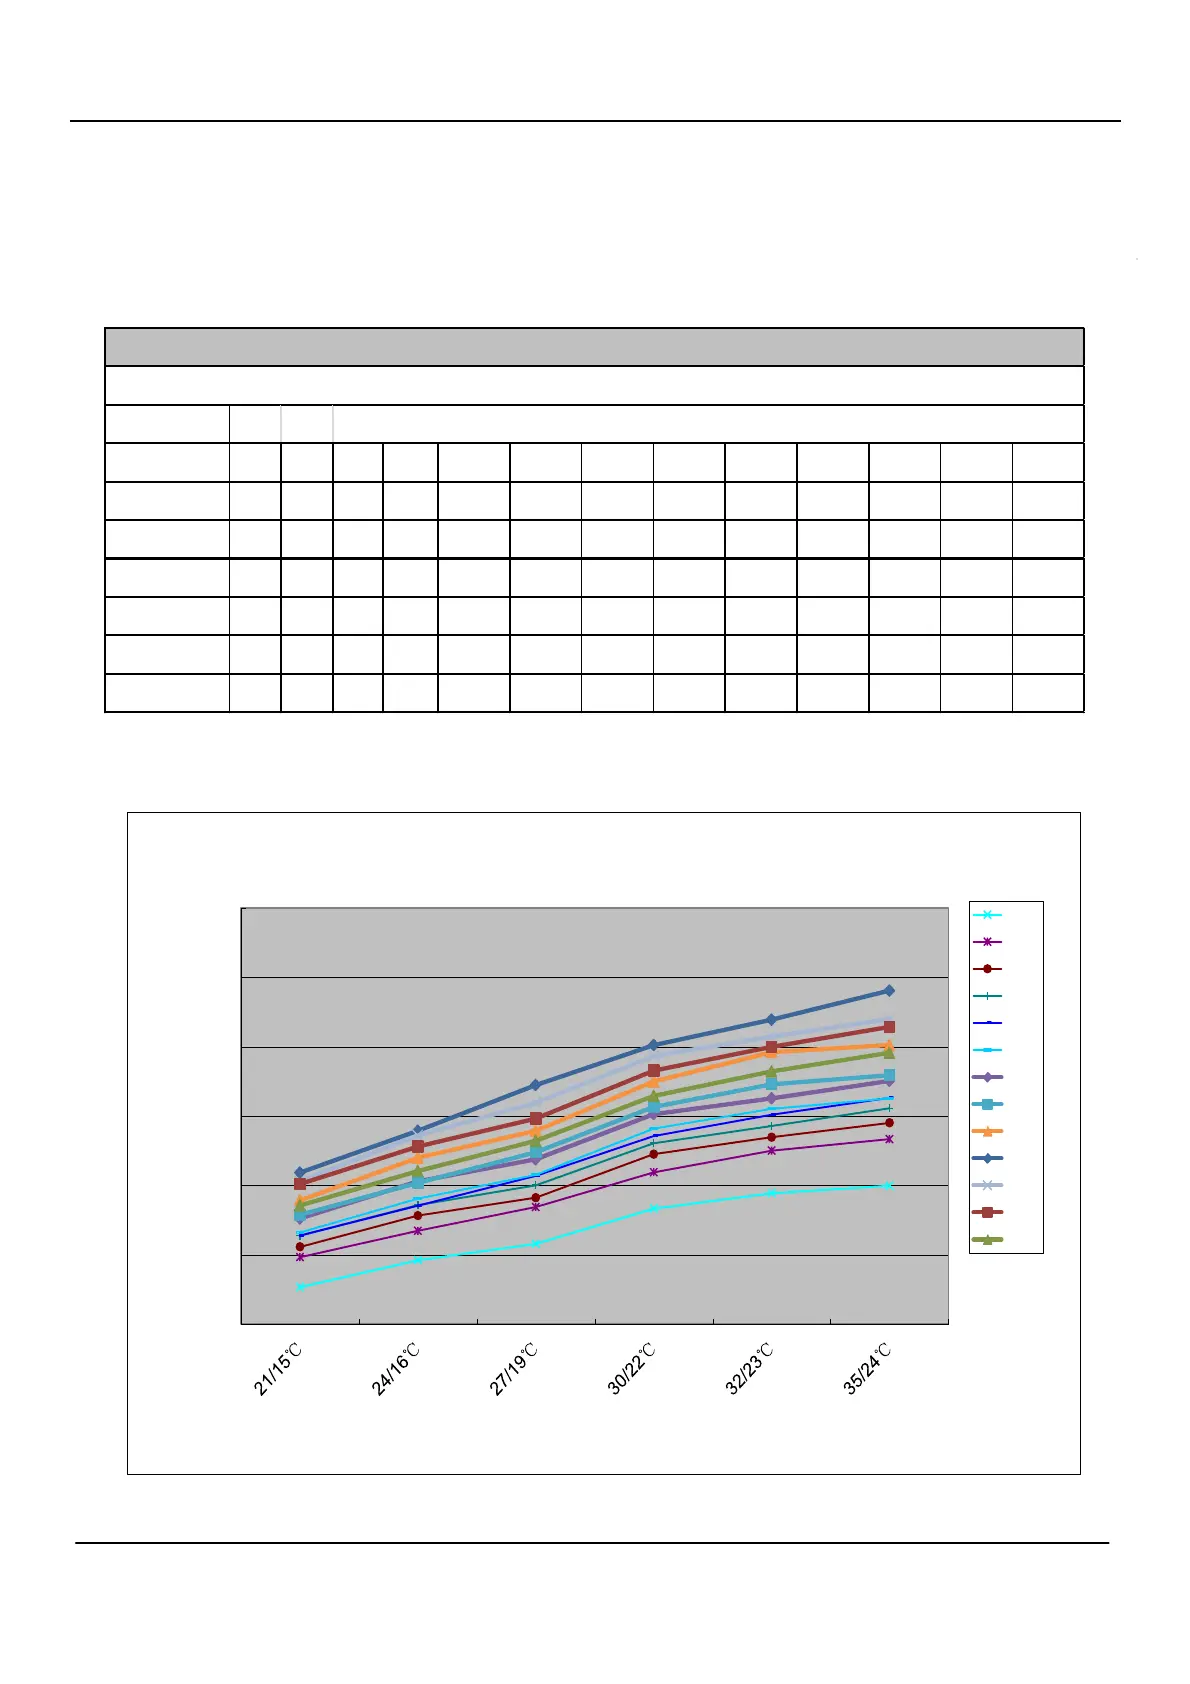
11.1 Cooling capacity-temperature curves
5
3
1000
1500
2000
2500
3000
3500
4000
cooling capacity and indoor/outdoor temp.curves
-20℃
-15℃
-10℃
0℃
8℃
15℃
20℃
25℃
30℃
35℃
38℃
40℃
43℃
indoor temp.
DB/WB -20℃ -15℃ -10℃ 0℃ 8℃ 15℃ 20℃ 25℃ 30℃ 35℃ 38℃ 40℃ 43℃
21/15℃ 1267 1484 1558 1639 1640 1661 1763 1789 1894 2094 2032 2012 1857
24/16℃ 1462 1674 1784 1860 1855 1907 2031 2020 2202 2395 2361 2283 2105
27/19℃ 1580 1845 1913 2003 2070 2078 2190 2241 2395 2725 2598 2483 2323
30/22℃ 1834 2096 2227 2306 2358 2410 2515 2568 2751 3013 2934 2830 2646
32/23℃ 1945 2252 2349 2431 2511 2554 2629 2731 2963 3197 3074 3000 2823
35/24℃ 1999 2335 2452 2557 2633 2630 2756 2796 3014 3406 3202 314
4 2958
cooling value-temerature table
 Loading...