Performance and ceves diagrams
45 Domestic air conditioner
11.Performence and cerves diagrams
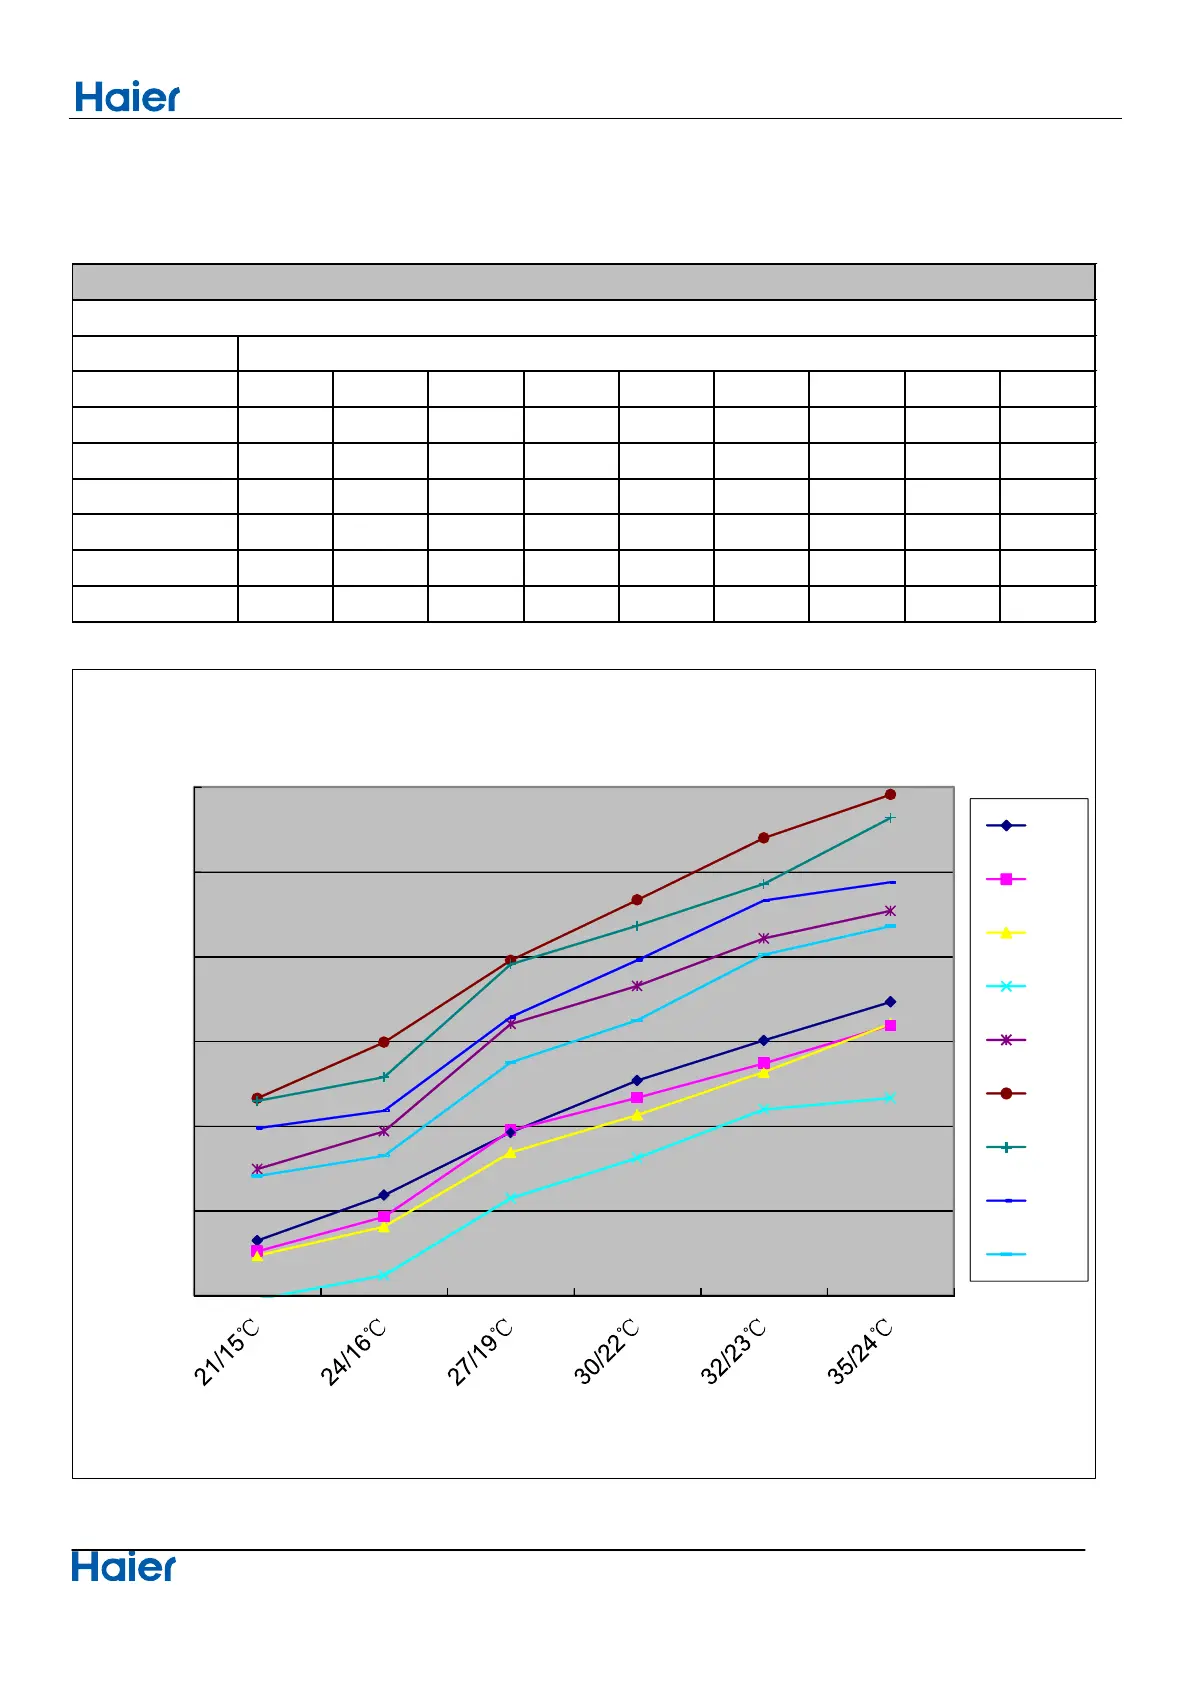
11.1 Cooling capacity-temperature curves
●
performance curves
cooling value-temerature table
indoor temp. outdoor temp.
DB/WB 10℃ 15℃ 20℃ 25℃ 30℃ 35℃ 38℃ 40℃ 43℃
21/15℃ 3824 3761 3736 3478 4246 4664 4648 4487 4205
24/16℃ 4092 3965 3906 3619 4469 4994 4789 4591 4324
27/19℃ 4463 4475 4344 4074 5102 5477 5454 5142 4876
30/22℃ 4769 4667 4566 4312 5327 5834 5682 5479 5124
32/23℃ 5005 4870 4818 4598 5607 6199 5928 5830 5511
35/24℃ 5232 5094 5103 4665 5770 6455 6318 5938 5680
cooling capacity and indoor/outdoor temp.curves
6500
10℃
6000
15℃
20℃
5500
25℃
5000
30℃
35℃
4500
38℃
4000
40℃
43℃
3500
indoor temp.(DB/WB)
cooling capacity (W)
 Loading...