Performance and curves diagrams
11.Performance and curves diagrams
51
Domestic air conditioner
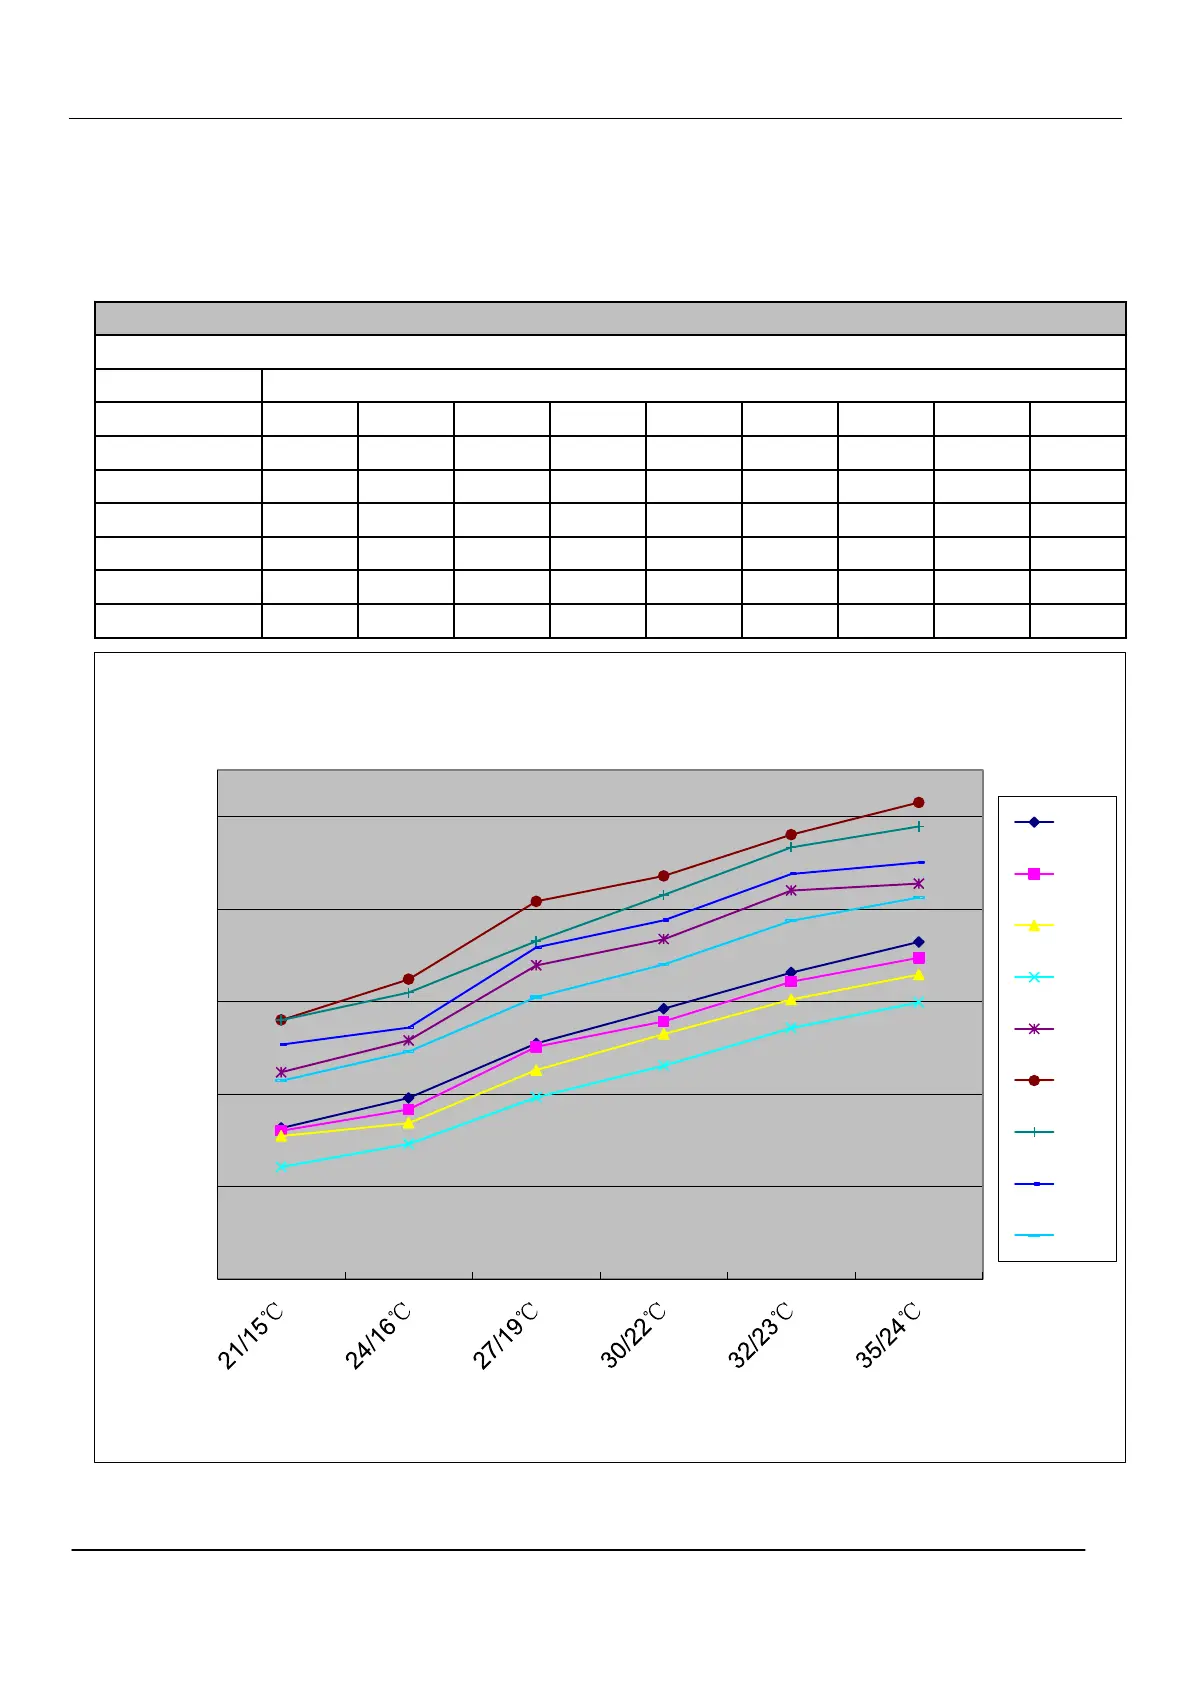
11.1 Cooling capacity-temperature curves
●
indoor temp.
DB/WB
10℃ 15℃ 20℃ 25℃ 30℃ 35℃ 38℃ 40℃ 43℃
21/15℃
5133 5105 5048 4714 5736 6300 6299 6035 5644
24/16℃
5459 5335 5188 4962 6081 6741 6598 6219 5960
℃
6047 6011 5759 5466 6892 7583 7152 7085 6549
30/22℃
6423 6286 6150 5808 7175 7858 7653 7380 6901
32/23℃
6814 6716 6524 6215 7701 8304 8167 7880 7373
35/24℃
7144 6973 6792 6492 7775 8652 8392 8004 7624
cooling value-temerature table
outdoor temp.
3500
4500
5500
6500
7500
8500
cooling capacity (W)
cooling capacity and indoor/outdoor temp.curves
10℃
15℃
20℃
25℃
30℃
35℃
38℃
40℃
43℃
indoor temp.(DB/WB)
 Loading...