EasyManuals Logo
Home>HP>Calculator>48gx

HP 48gx User Manual

HP 48gx
116 pages
To Next Page IconTo Next Page
To Previous Page IconTo Previous Page
Page #70 background imageLoading...
Page #70 background image
Lesson
21:
Plotting
a
Function
A
function
takes
one
or
more
arguments
as
inputs
and
transforms
them
mathematically
into
exactly
one
output.
A
function
can
be
plotted
by
graphing
a
series
of
outputs
against
a
corresponding
series
of
inputs.
Plotting
functions
on
the
HP
48
is
a
matter
of
doing
the
following:
»
Entering
or
choosing
the
function
to
plot.
»
Declaring
the
independent
variable
and
the
horizontal
range
of
that
you
want
to
view.
»
Either
declaring
the
vertical
range
to
be
displayed
or
choosing
to
let
the
HP
48
automatically
scale
it
for
you.
»
Making
sure
that the
angle
mode
(Degrees,
Radians,
Grads)
is
properly
set.
»
Setting
the
other
plot
display
options.
All
of
these
steps
can
be
accomplished
smoothly
and
quickly
in
the
PLOT
application.
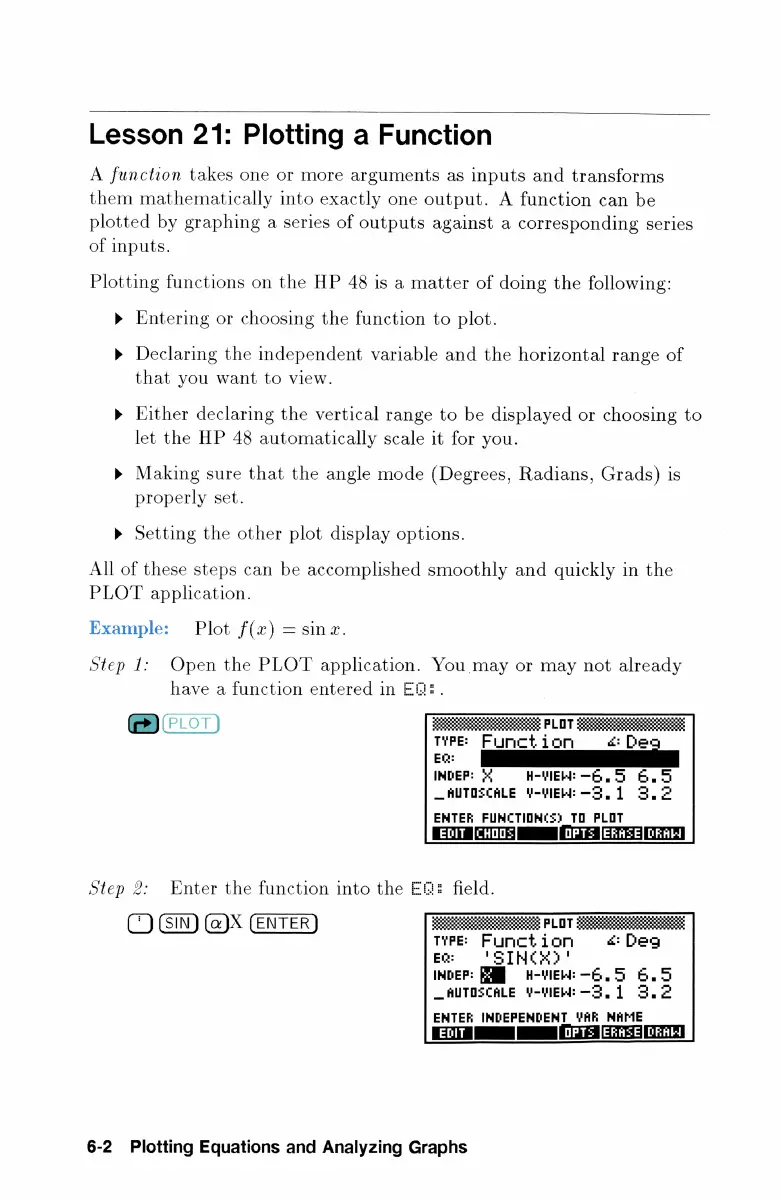
Example:
Plot
f(x)
=
sin
x.
Step
1:
Open
the
PLOT
application.
You
may
or
may
not
already
@®ron)
i
sae
PLOT
™PE:
Function
a
EQ:
INDEP:
J
H-VIEW:
—6.3
6.3
_RAUTOECALE
V¥-VIEW:=32.1
3.2
ENTER
FUNCTION(E)
TO
PLOT
EDIT
JCHODZ]
|
Step
2:
Enter
the
function
into
the
Efi:
field.
(GH)
@X
ENTER)
TYPE:
Function
<
Deg
ER:
'SIHCKE)!
iNDEP:
Gl]
H-YIEW:
—5.5
6.5
_AUTOSCALE
¥-vIEW:-2,1
3.2
ENTER
INDEPENDENT
VAR
NAME
ECT]
|
[OPTS
[ERAZE[DRAL]
6-2
Plotting
Equations
and
Analyzing
Graphs

Questions and Answers:

Question and Answer IconNeed help?

Do you have a question about the HP 48gx and is the answer not in the manual?

HP 48gx Specifications

General IconGeneral
BrandHP
Model48gx
CategoryCalculator
LanguageEnglish

Related product manuals