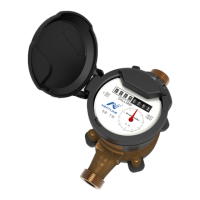
The screen displays the data received.
Figure 25 – Receiving Data
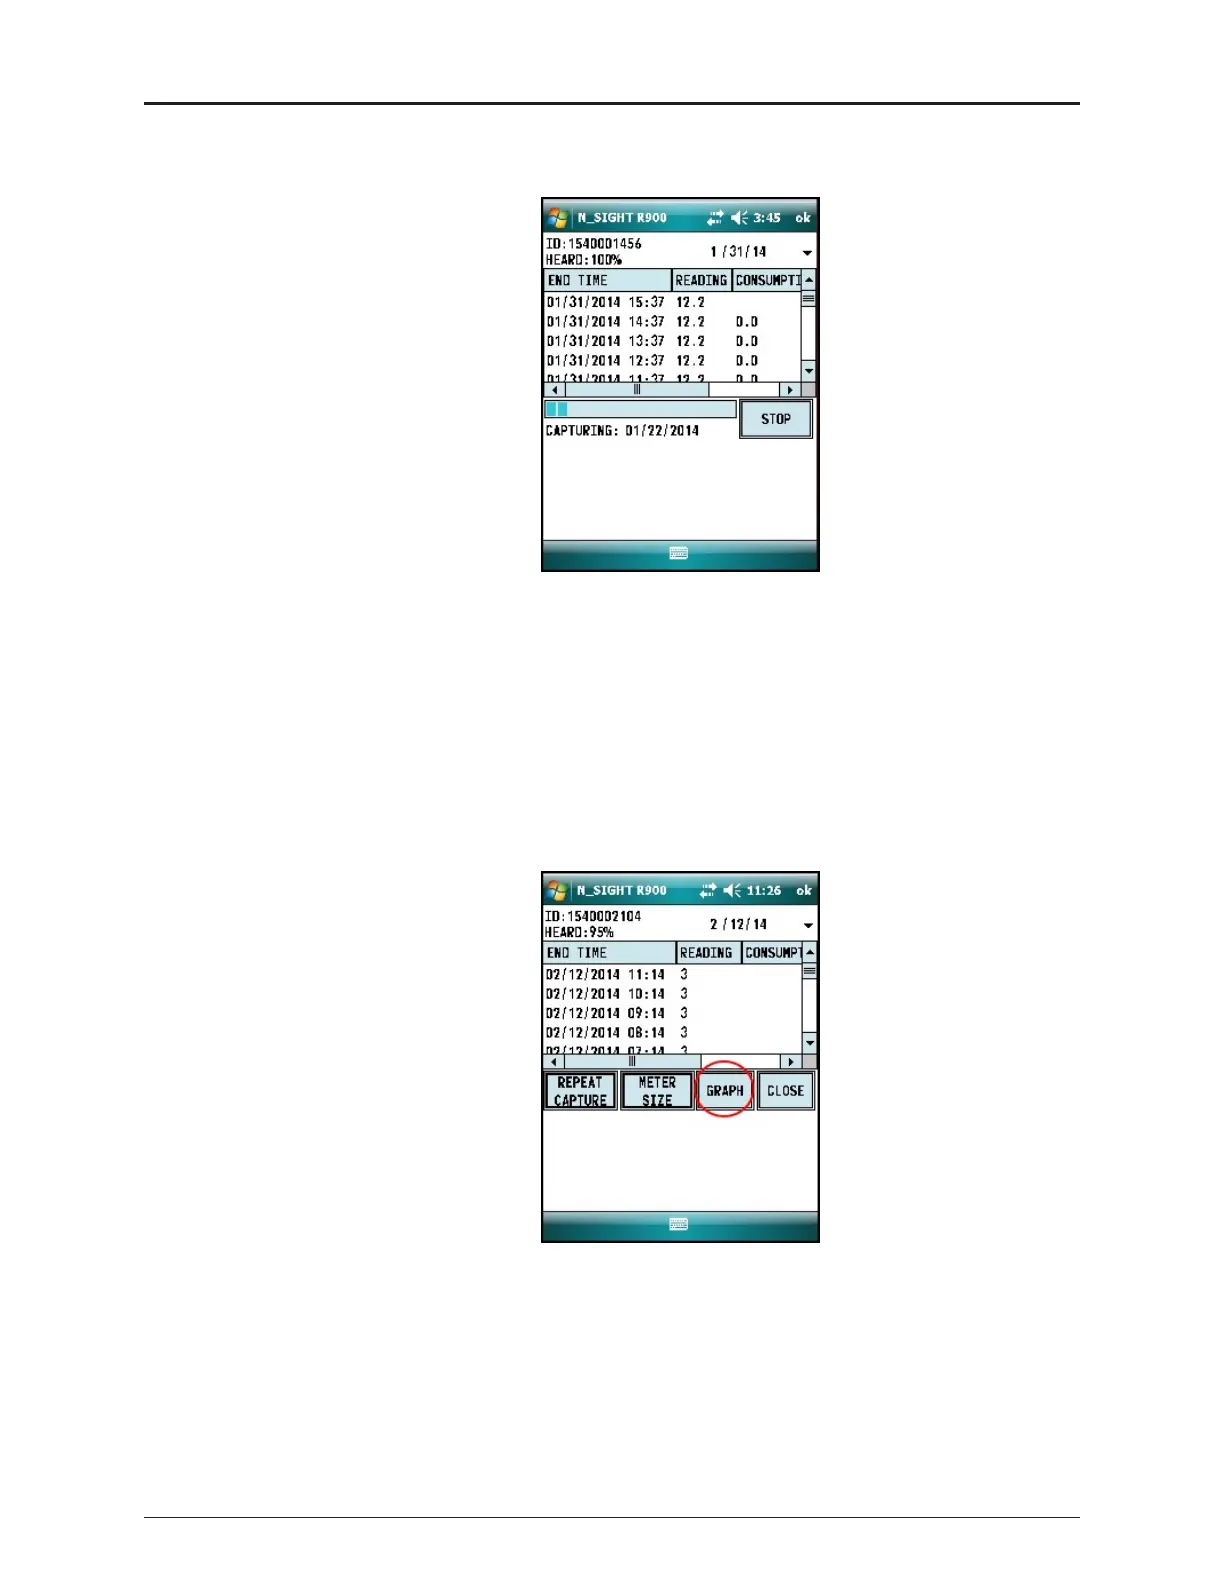
2. After the data logging process is completed, choose the meter size. See Figure 22 on
page 23.
3. Click GRAPH to display the data in a graph. See examples of graphs in Figure 27 on
page 26.
The HHU processes and saves the data. After closing the data logging screen, the
unit performs a backup.
Figure 26 – Graph Button
ProCoder™)R900i™ Installation and Maintenance Guide 25
Chapter 5: Data Logging Extraction
 Loading...