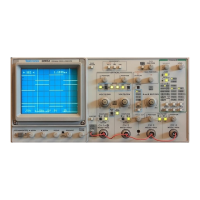
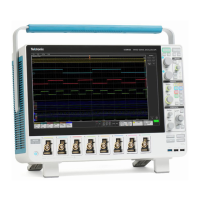
2. T
ap a Plots button to add that plot for the measurement to the screen.
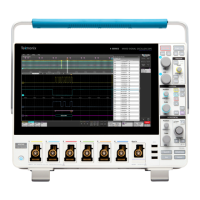
The following shows adding a Histogram plot.
You can add more than one plot to measurements (to different measurements or the same measurement). For example, you can add
two histogram plots for the same measurement, set one to display the X-Axis with a Logarithmic scale, and the other plot to display the
X-Axis with a Linear scale.
Operating basics
4 Series MSO MSO44, MSO46 Quick Start Manual 55
 Loading...