3
Overview of an Oscilloscope
Introduction
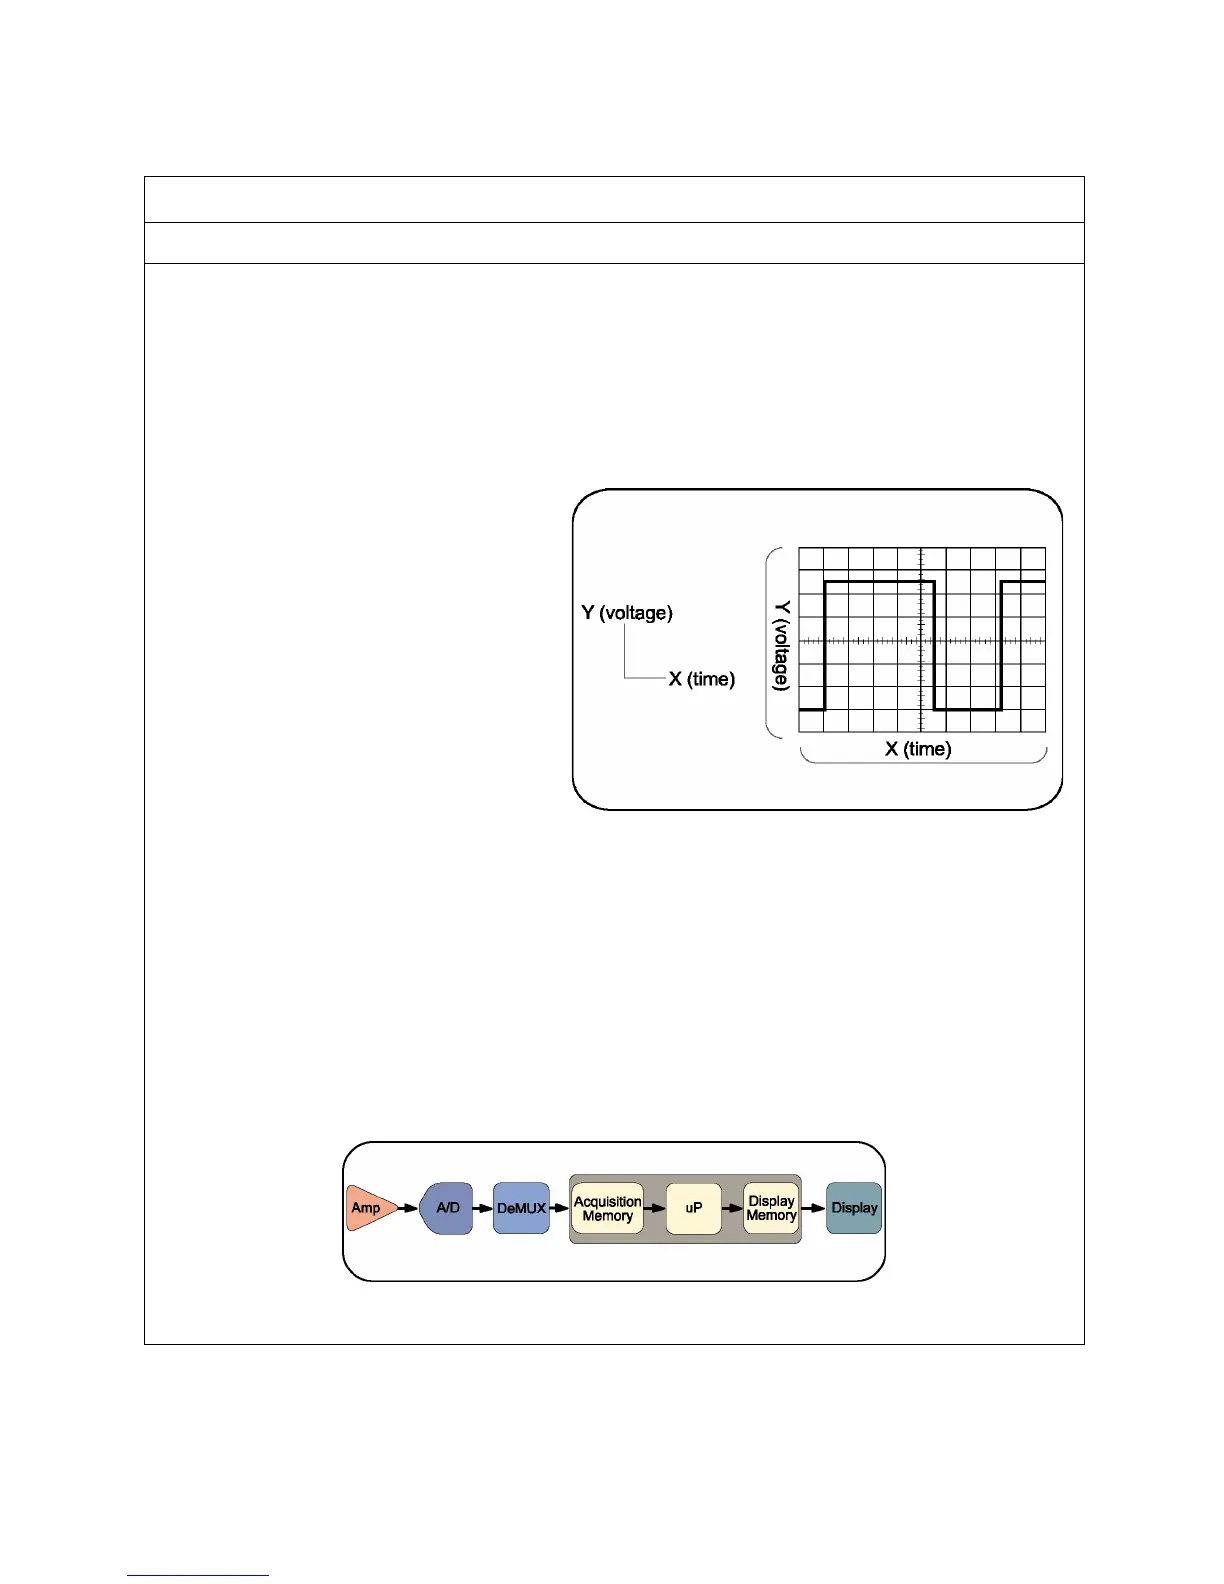
An oscilloscope is an electronic test instrument that displays electrical signals graphically, usually as a
voltage (vertical or Y axis) versus time (horizontal or X axis) as shown in figure 1. The intensity or
brightness of a waveform is sometimes considered the Z axis. There are some applications where other
vertical axes such as current may be used, and other horizontal axes such as frequency or another
voltage may be used.
Oscilloscopes are also used to measure electrical signals in response to physical stimuli, such as
sound, mechanical stress, pressure, light, or heat. For example, a television technician can use an
oscilloscope to measure signals from a television circuit board while a medical researcher can use an
oscilloscope to measure brain waves.
Oscilloscopes are commonly used for
measurement applications such as:
• observing the wave shape of a signal
• measuring the amplitude of a signal
• measuring the frequency of a signal
• measuring the time between two events
• observing whether the signal is direct
current (DC) or alternating current (AC)
• observing noise on a signal
An oscilloscope contains various controls that assist in the analysis of waveforms displayed on a
graphical grid called a graticule. The graticule, as shown in figure 1, is divided into divisions along both
the horizontal and vertical axes. These divisions make it easier to determine key parameters about the
waveform. In the case of the TBS1000 Series oscilloscope, there are 10 divisions horizontally and 8
divisions vertically.
A digital oscilloscope acquires a waveform by conditioning the input signal in the analog vertical
amplifier, sampling the analog input signal, converting the samples to a digital representation with an
analog-to-digital converter (ADC or A/D), storing the sampled digital data in its memory, and then
reconstructing the waveform for viewing on the display.
Figure 2: Typical Digital Oscilloscope Block Diagram
Figure 1: Typical Oscilloscope Display
 Loading...