University of Portland - p. 3 of 9 - Oscilloscope - TDS3012B.docx
Reading the Display
The oscilloscope generates a graph with volts on the vertical axis and time on the horizontal axis.
This section will explain how to read the display in order to measure time and voltage.
Measuring Voltage
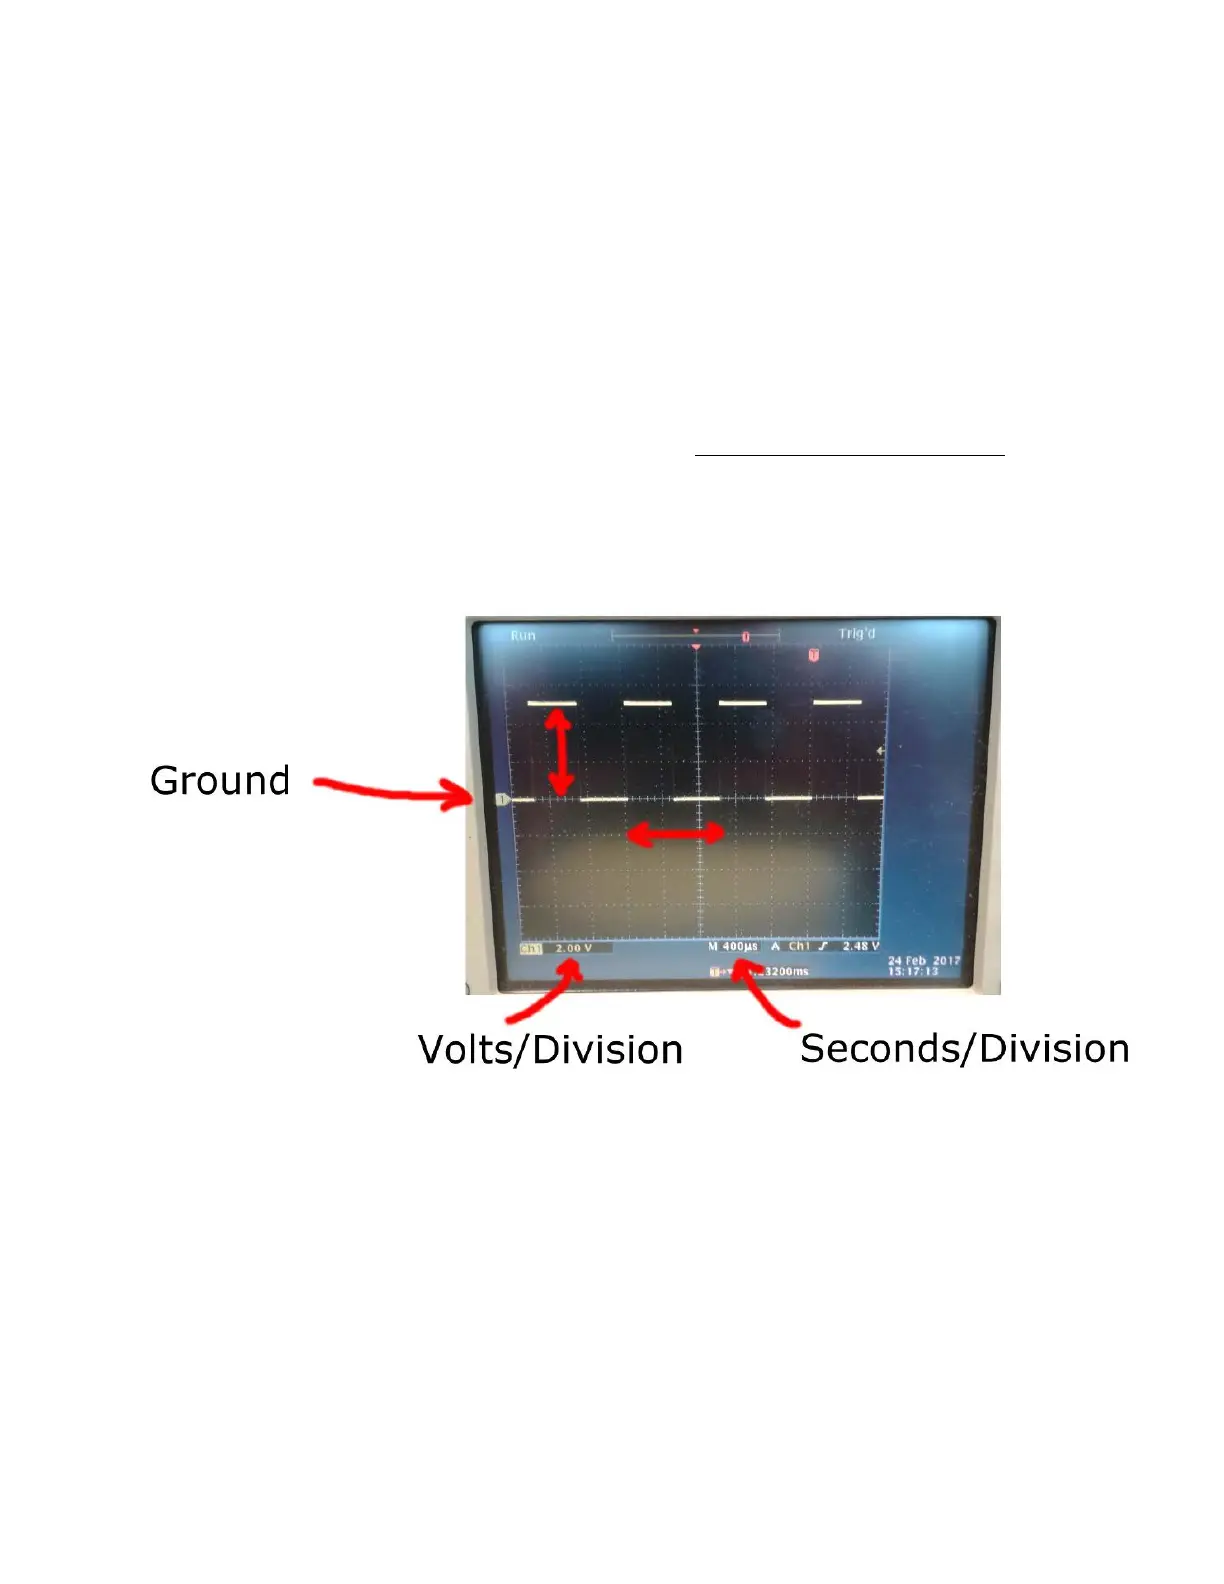
The location on the screen that represents ground (or 0 Volts) is marked by an arrow on the left
side of the screen (see Figure 3). Note that the screen is divided into 8 divisions vertically,
where the divisions are marked by dotted lines on the screen. The number of volts that each
division represents (or volts/division) is displayed in the lower left part of the screen. To
measure a voltage, we can count the number of divisions above or below the ground level and
multiply by the volts/division value. For example, in Figure 3, the maximum voltage of the
square wave is 2.5 divisions above the ground level, so the voltage is 2.5 divisions * 2
volts/division = 5 Volts. If the voltage is below the ground level, then the voltage is negative.
Figure 3: Oscilloscope Screen
Measuring Time
Note that the screen is divided into 10 divisions horizontally, where the divisions are marked by
dotted lines on the screen. We can measure the time between two parts of a signal by counting
the number of divisions in the horizontal direction and multiplying by the number of seconds per
division. In Figure 3, for example, there are 2.5 divisions in one period of the wave, so the
period is 2.5 divisions * 400 µS = 1 mS.

 Loading...


