You should run plotintg() in Approx mode, and the Graph Mode must be set to FUNCTION. This same
program works with either the 89 or the 92+. If you have a global variable called x, delete it before
running plotintg().
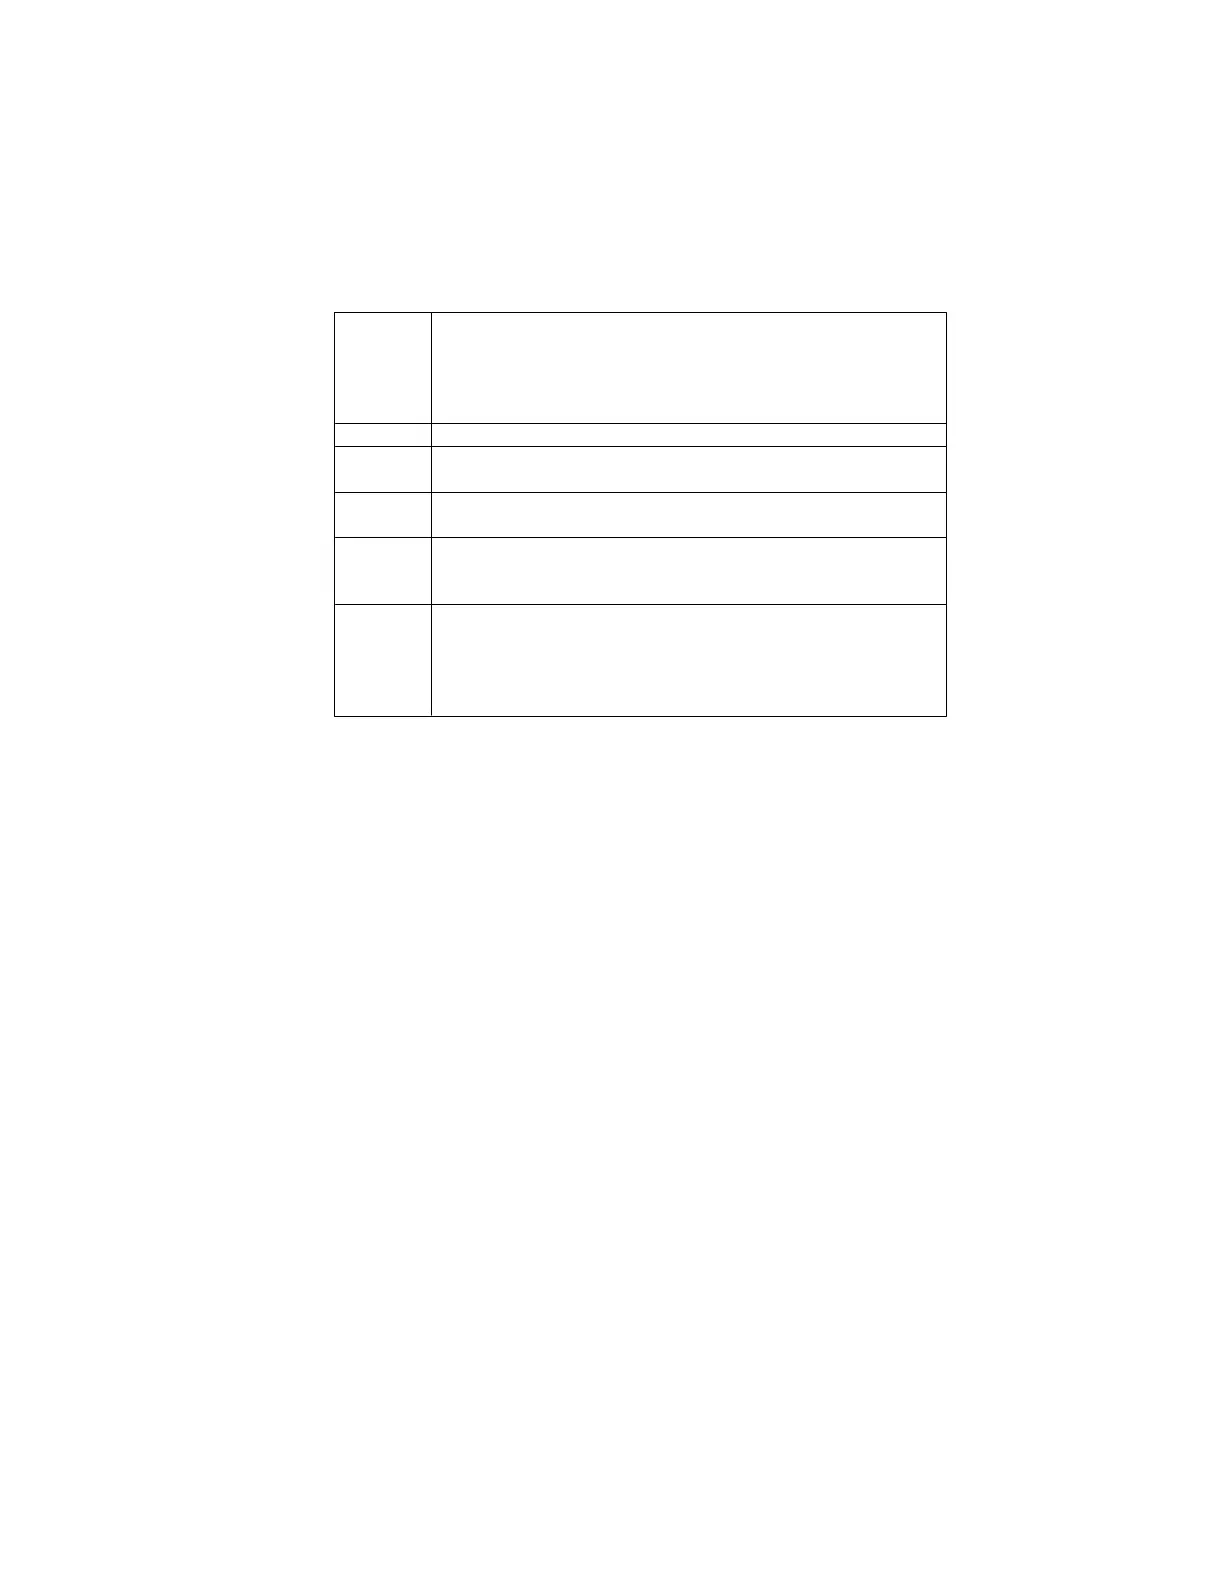
These are the program arguments:
The plot resolution in pixels, If res = 1, then the function is
plotted at each pixel. If res = 3, then the function is plotted at
each third pixel.
res must be greater than or equal to 1. There is no upper
limit, above resolutions of 20 the plot is very coarse.
res
The number of the data plot to use. If you have existing data
plots in the Y= Editor that you don't want destroyed by the
program, choose an unused plot number.
pn
The maximum value of x to plot
You must set xh > xl
xh
The minimum value of x to plot
You must set xl < xh
xl
The lower integration limitx0
The name of the function to be plotted, as an expression or
string. The plot is much faster if fname is an expression, but
some functions can't be passed as expressions.
The independent variable must be x
May also be an expression in x
fname
Note that you can pass the integrand fname as an expression or a string. This flexibility is provided so
that expressions plot quickly, but the program still works for integrands that cannot be passed as
expressions. This is a limitation of TI BASIC. In general, functions that contain conditional expressions
cannot be passed as expressions. If you are not sure that your function can be passed as an
expression, just try it - you will quickly get an error message.
For example, to plot a function called fun1() from x = 0 to x = 15, use this call:
plotintg("fun1(x)",0,15,1,2)
which will use plot number 1 and a resolution of 2 pixels. To plot the sine integral shown above, you
could use this call:
plotintg(sin(x)/x,0,15,1,1)
which plots the sine integral from x=0 to x=15, using data plot number 1 and a resolution of 1.
plotintg() has these side effects:
! All functions and plots in the Y= Editor are turned off.
! The global variables xx and yy are created and not deleted. If you have any variables called xx or
yy, they will be overwritten.
! The data plot remains selected in the Y= Editor.
! The plot Window variables are changed and not restored.
The program listing above includes comments which are not included in the actual source file. Remove
the comments if you are typing the program instead of using GraphLink.
4 - 11