16 18-AC124D1-1A-EN
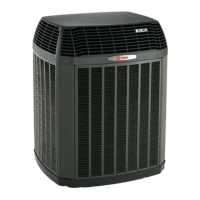
STEP 6 - Adjust refrigerant level to attain proper gage
pressure.
Add refrigerant if the Liquid Gage Pressure is lower than
the chart value.
1. Connect gages to refrigerant bottle and unit as
illustrated.
2. Purge all hoses.
3. Open bottle.
4. Stop adding refrigerant when liquid line temperature
and Liquid Gage Pressure matches the charging
chart Final Subcooling value.
Recover refrigerant if the Liquid Gage Pressure is higher
than the chart value.
20 MIN.
STEP 7 - Stabilize the system.
1. Wait 20 minutes for the system condition to
stabilize between adjustments.
Note: When the Liquid Line Temperature and Gage
Pressure approximately match the chart, the system is
properly charged.
2. Remove gages.
3. Replace service port caps to prevent leaks.
Tighten finger tight plus an additional 1/6 turn.
STEP 9 - Record System Information for reference.
Record system pressures and temperatures after
charging is complete.
Outdoor model number = _________________
Measured Outdoor Ambient = __________ º F
Measured Indoor Ambient = __________ º F
Measured Liquid Line Temp = __________ º F
Measured Suction Line Temp = __________ º F
Liquid Gage Pressure = __________ PSI
Suction Gage Pressure = __________ PSI
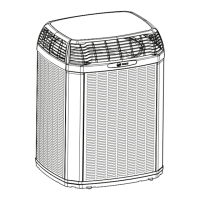
STEP 8 - Verify typical performance.
Refer to System Pressure Curves at the end of
the document to verify typical performance.
Cooling @ 1450 SCFM Heating @ 1350 SCFM
DISCHARGE PRESSURE (PSIG)
OUTDOOR TEMPERATURE (Degree F)
110
115
120
125
130
135
140
145
150
155
160
165
170
40 60 80 100 120
200
250
300
350
400
450
500
550
40 60 80 100 120
(1)
(1)
(3)
(3)
(5)
(4)
(2)
(2)
INDOOR ENTERING
WET BULB CURVES
TOP TO BOTTOM
71, 67, 63 AND 59 DEG F.
INDOOR ENTERING
WET BULB CURVES
TOP TO BOTTOM
71, 67, 63 AND 59 DEG F.
30
40
50
60
70
80
90
100
110
120
130
140
-5 5152535455
5
200
250
300
350
400
450
500
-5 5152535455
5
INDOOR ENTERING
DRY BULB CURVES
TOP TO BOTTOM
80, 70, AND 60 DEG F.
INDOOR ENTERING
DRY BULB CURVES
TOP TO BOTTOM
80, 70, AND 60 DEG F.
 Loading...