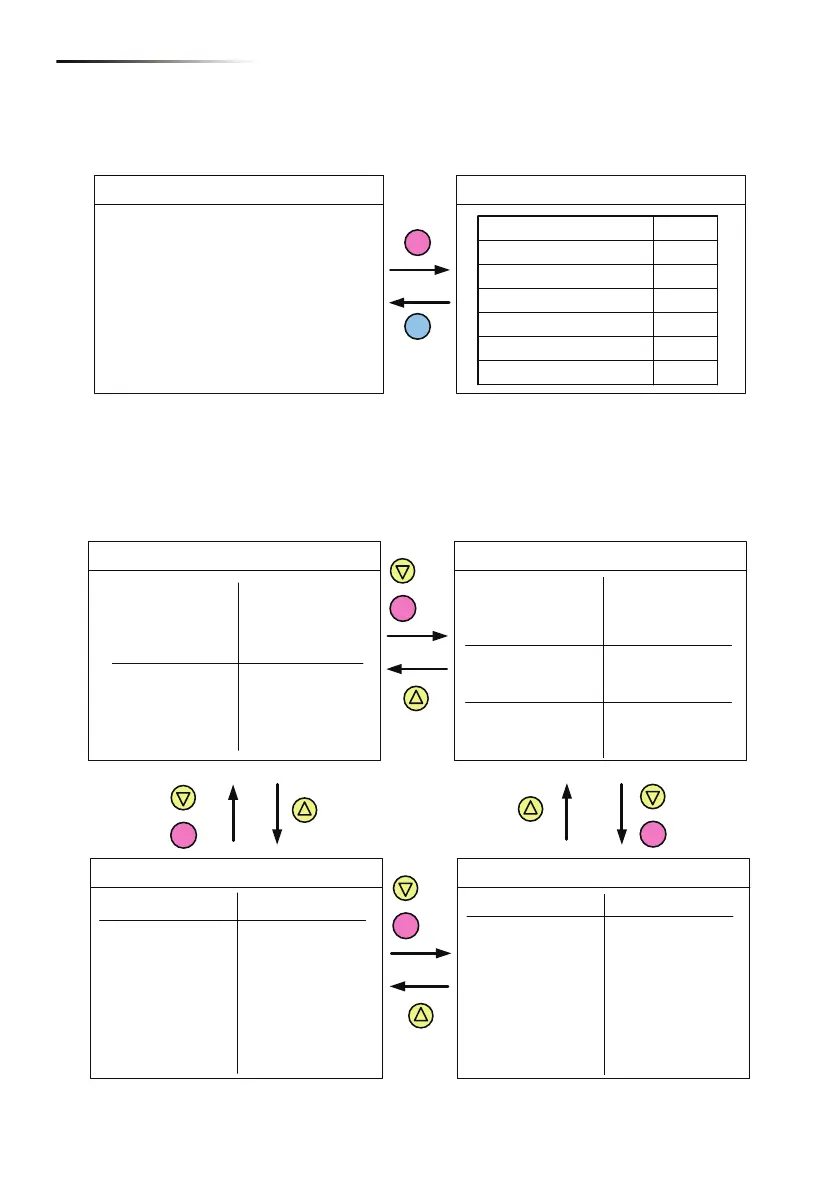
5.2.4. Event Log
This page can record 30 events (error or fault) that had occurred before.
Press ENT in this page can view the statistical data.
5.2.5. Operation Data
The operation data is divided into 4 pages. They record the maximum and
minimum values of history; including voltage, current, power and temperature.
Event Log
21. Jun 2010 13:50
1. 15/02/2010 17:02
2. 02/12/2009 09:13
3. 23/11/2009 15:28
4. 03/10/2009 06:02
5. 27/05/2009 05:52
6. 18/02/2009 16:46
AC Freq High
No Grid
HW Fan
Insulation
Insulation
HW DC Injection
Summary
21. Jun 2010 13:50
HW DC Injection
Temperature
HW NTC1 Fail
HW NTC2 Fail
HW NTC3 Fail
HW NTC4 Fail
Event Count
2
1
0
0
0
0
Event Summary – 1/8
1
0
ENT
EXIT
Figure 5-6 Event log flow chart
Figure 5-7 Operation data page
Operation Data – 1/4
21. Jun 2010 13:50
Input1
Voltage
Current
Power
Voltage
Current
Power
Input2
Maximum
(Vdc)
(A)
(W)
(Vdc)
(A)
(W)
811
25.2
11200
785
26.3
10301
Operation Data – 2/4
21. Jun 2010 13:50
L1
Voltage
Current
Power
Voltage
Current
Power
Voltage
Current
Power
L2
L3
Maximum
(Vdc)
(A)
(W)
(Vdc)
(A)
(W)
(Vdc)
(A)
(W)
247
30.5
6810
244
30.3
6756
245
30.1
6745
Operation Data – 4/4
21. Jun 2010 13:50
Temperature Max. Min.
Inside
Heatsink - 1
Heatsink - 2
Heatsink - 3
(℃)
(℃)
(℃)
(℃)
59.3
75.5
74.2
73.6
15.7
15.3
15.2
15.2
Operation Data – 3/4
21. Jun 2010 13:50
Output
Voltage
Current
Power
Frequency
(Vdc)
(A)
(W)
(Hz)
Maximum
247
30.5
20311
50.10
ENT
or
ENT
or
ENT
or
ENT
or
26
Turn on/off PV inverter
 Loading...