Introduction
Eaton Advanced ePDU Troubleshooting Guide P-164000140—Rev 1 www.eaton.com/ePDU 3
.
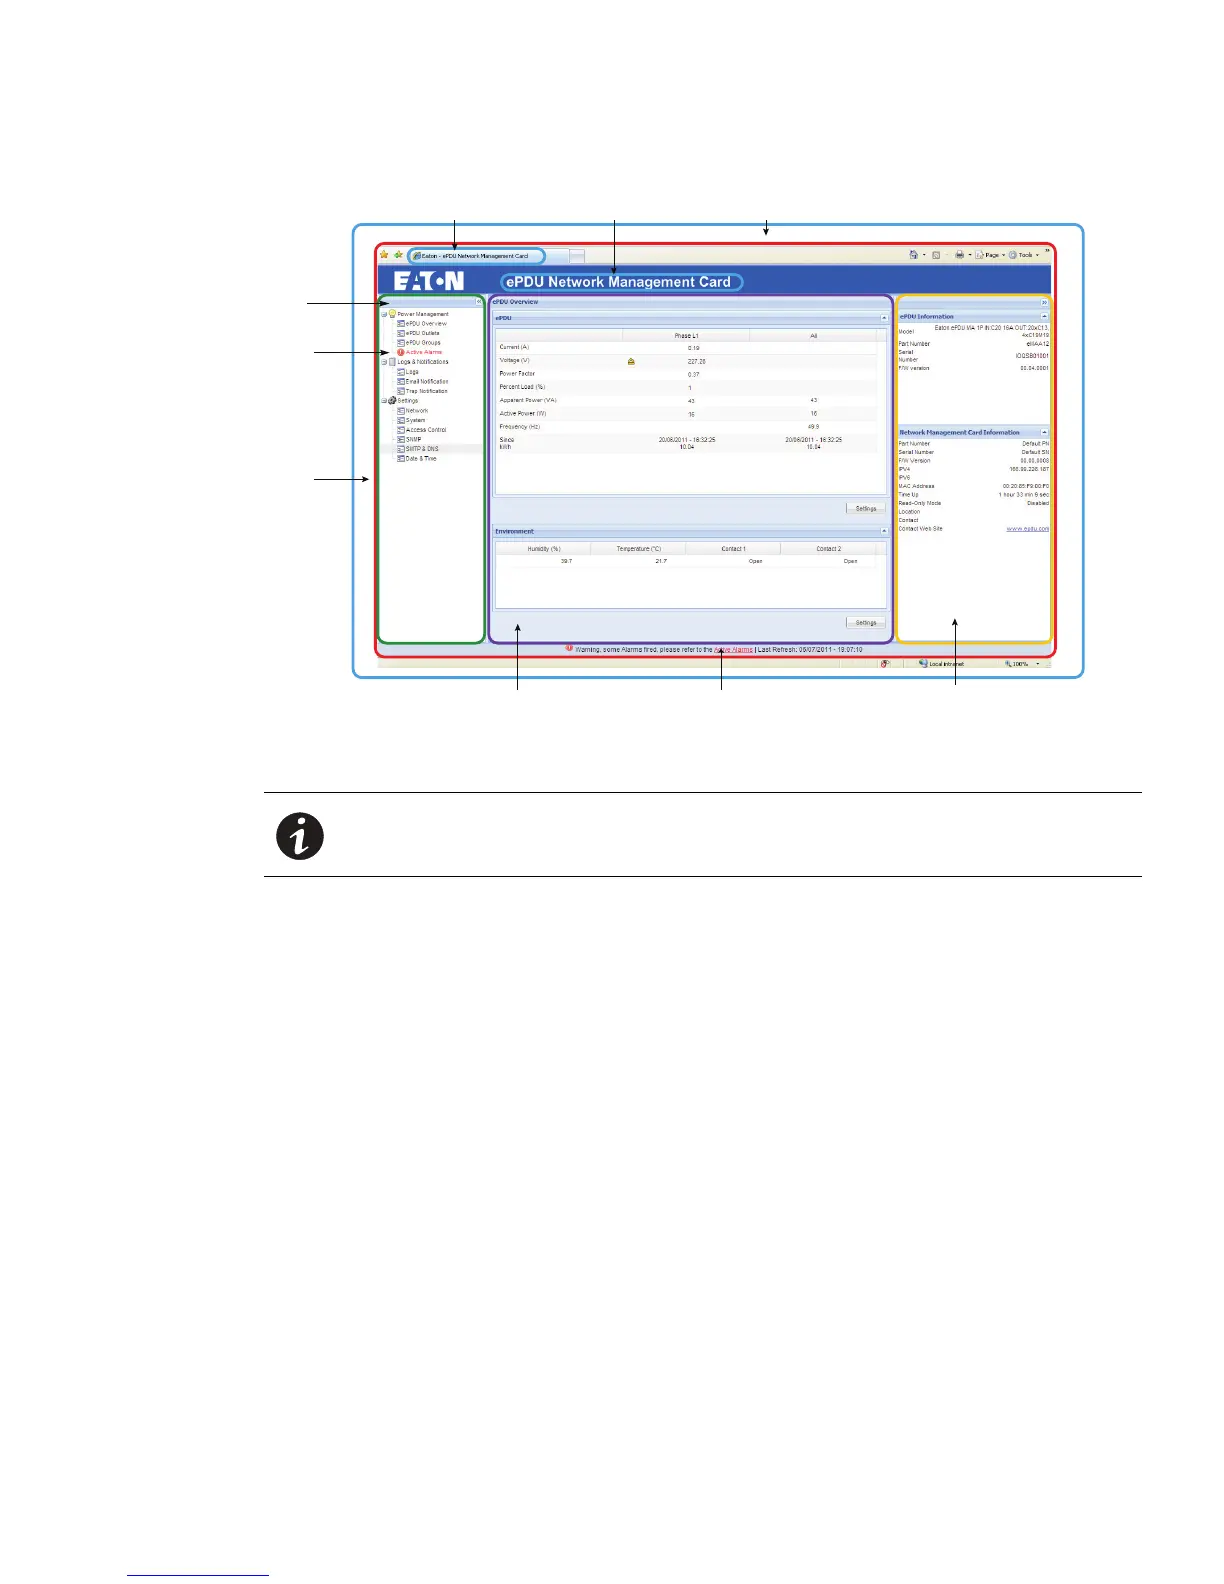
Host WindowPage Title Tab Application Header Bar
Main
Application
Page
Menu
Bar
Menu Selection Display
ePDU and Network Management
Card Identication Data
Refresh Bar Alarm Notication
Active
Alarm
Figure 3. ePDU Web Interface Opening Window
NOTE The data that displays on the Web interface depends on the type of ePDU model
you are using.
The Menu Bar provides three groups of selections. All of
these selections have options that can help you
troubleshoot problems.
l
Power Management
- Use the Power Management page to see current operating measurements for the ePDU that is reporting
dat
a.
- Use the ePDU Outlets page to obtain information on individual outle
ts or factory groups. You can also use
this page to set individual outlets or factory groups to On, Off, or Reboot.
- Use the Active Alarms page to retrieve current alar
ms and see a list of alarms by date, time, and
description.
l
Logs and Notifications
- Use the Logs & Notifications menu selections to see
a list of the most recent events or clear the log.
l
Settings
- Use Settings menu selections to correct prob
lems arising from configuration settings.
Checking for E-mail Notifications with History Reports
Use the Web interface to set e-mail notifications (E-mail Notification page) and trap receivers (Trap Notification
page). E-mail notifications include comprehensive or filtered event history reports attached to daily e-mail
messages. The detailed data logs you receive can be useful for historical statistical analysis and diagnostics.
 Loading...