14
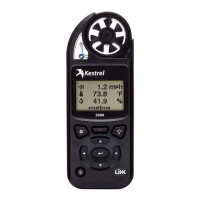
In addition to taking live measurements, your Kestrel 5
Series weather meter is a powerful data logger. The Kestrel
will automatically create a time stamped data log of all
measurements at the logging interval you set. Additional log
points can also be captured manually. Logged data can be
accessed four ways:
» Viewed on the Kestrel Meter on the Data Graph Screen and
Data Log Detail Screens.
» Kestrel LiNK mobile apps available in the App Store and
Google Play Store. Requires a Kestrel LiNK-enabled meter
and compatible Bluetooth® LE devices.
» Exported to a PC or Mac using Kestrel LiNK software and a
Kestrel USB Dongle (available separately). Requires a Kestrel
LiNK-enabled meter
» Exported to your Windows or Mac computer using Kestrel
LiNK software and a Kestrel USB Data Transfer Cable
(available separately). All 5 Series Kestrel meters can connect
to Kestrel LiNK using a Kestrel USB Data Transfer Cable.
TURNING ON AND ADJUSTING AUTOMATIC DATA LOGGING:
» In the main Options menu, scroll to and select Memory
Options. Scroll to and select Auto Store and set to ON.
Scroll to Store Rate and adjust to desired frequency of
automatic weather data logging.
» In the Memory Options sub menu scroll to Overwrite and
set to On to allow the data log to wrap once full and O to
stop logging when full.
» When Auto Store is set to On, the Kestrel unit will
CREATING, VIEWING, & EXPORTING DATA LOGS
automatically begin logging at the rate set in
Store Rate.
MANUAL DATA LOGGING:
» Individual data points can be added to the log at
any time by pressing the Capture button.
» Manual capture simply adds every measurement
to the data log at the capture time/date.
VIEWING LOGGED DATA ON THE KESTREL METER:
» Scroll to the Graph Data Screen of the desired
measurement. This can be done by scrolling right
from the desired Current Measurement Screen or
scrolling vertically from another measurement’s
Graph Data Screen.
» A graph of the most recently logged data points
will be displayed and continue to grow at the
selected store rate.
» To view individual data log points, or to view
graph data older than what is shown in the Graph
Data Screen, press Select to open the Data Log
Detail Screen. Scrolling left or right will move the
bar highlighting individual data points. Log values
are shown in the upper left and the time stamp is
shown along the bottom. Press Exit to return to
the Graph Data Screen.
» To change the resolution of the graph, scroll to
and select Graph Scale in the Options menu.
Scroll to and select the desired measurement
w ww . . co m
information@itm.com1.800.561.8187

 Loading...