B11 User Guide
Mimosa Networks Help Site Dashboard
Copyright © 2015 Mimosa Page 11
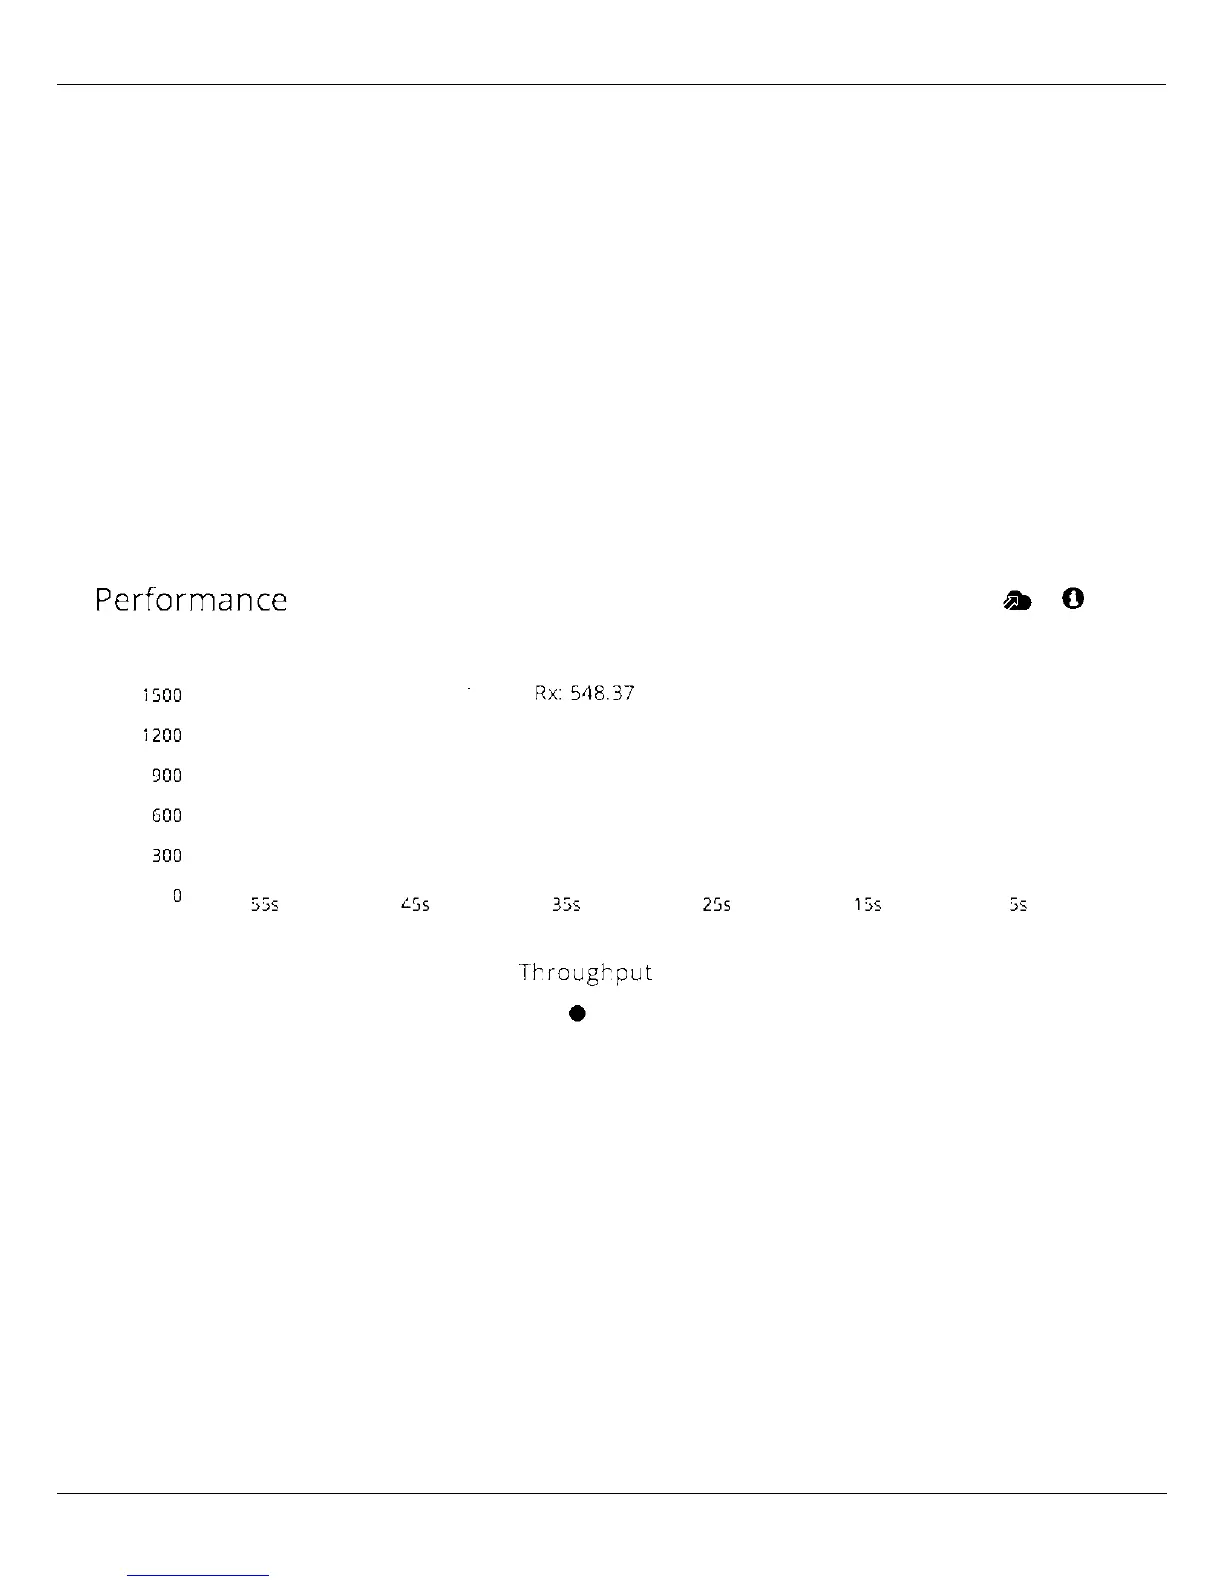
Reading the Performance Charts
IP Throughput and Packet Error Rate (PER) are charted over 60 seconds in 5-second intervals. The newest data
shows up on the right and scrolls to the left over time. You can toggle between the charts by clicking on the
navigation circles at the bottom of the panel. If enabled, click on the cloud icon to view historical data within the
Manage application.
The IP Throughput graph plots three lines representing transmit, receive, and aggregate (summed) throughputs at
the datagram (or packet) layer excluding any protocol or encapsulation overhead. The results here may differ from
those measured using speed test tools, due to protocol overhead and encapsulation. Note that internal Bandwidth
test results are excluded.
The Packet Error Rate (PER) is the number of packets with errors divided by the total number of packets sent within
a 5-second period. Ideally, this value should be below 2%, while higher values indicate the presence of interference.
Tx PER is an indication that the local radio did not receive an ACK from the remote radio, so is forced to retransmit
the same information again. Rx PER is a value sent from the remote radio to the local radio in management frames.
 Loading...