7
1 Broken-line Graphs
1-1 Broken-line Graph Basic Settings
The Broken-line Graph objects display the graphs of the current value of array variables or multiple
variables of the same data type.
Beware that a Broken-line Graph object does not operate in the simulation function of Sysmac Studio.
You must transfer data to the NA unit and operate the actual unit to confirm operations.
1-1-1 Registering Data Group
The variables that are to be displayed in a Broken-line Graph should be registered in Data
Groups. This function is equivalent to the “Broken-line Graph Group Setting” of the NS
series.
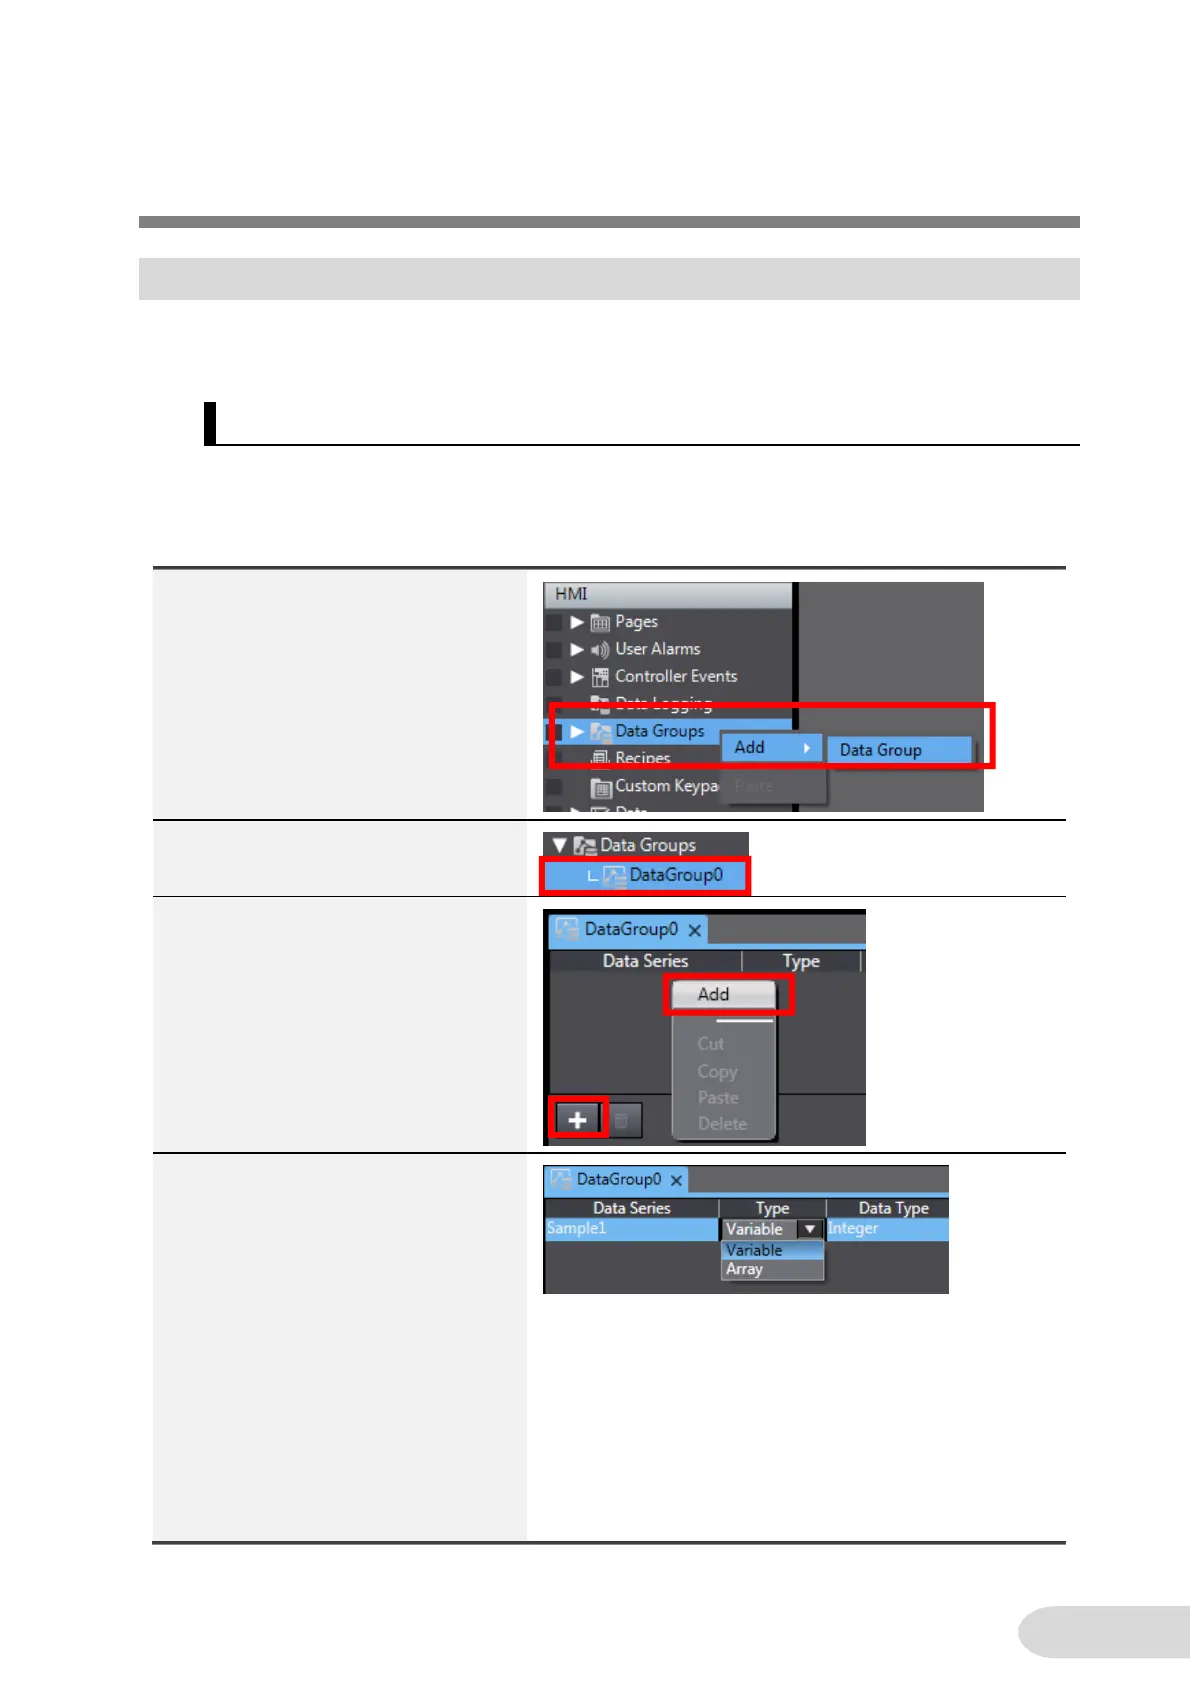
1. In the Multiview Explorer, right-click
[HMI]-[Data Groups], and click
[Add]-[Data Group].
2. Double-click the added
[DataGroup0].
3. Create the data to be displayed as a
graph.
Right-click on the edit pane and
click “Add”, or click the [+] button.
4. Enter an arbitrary name in [Data
Series]. The name is used in the
Properties of the Broken-line Graph
object to be described later.
Under [Type], choose the type of
variables to be used in a graph from
either “Variable” or “Array”. If you
use multiple variables as a group,
choose “Variable”. To display the
data of the array variable as a
graph, select “Array”.
In [Data Type], specify the data type
of the variables to be used in the
graph. Make sure to unify the data
type of the variables that are to be
used in a single data series.
 Loading...