Display a Wavefo
rm
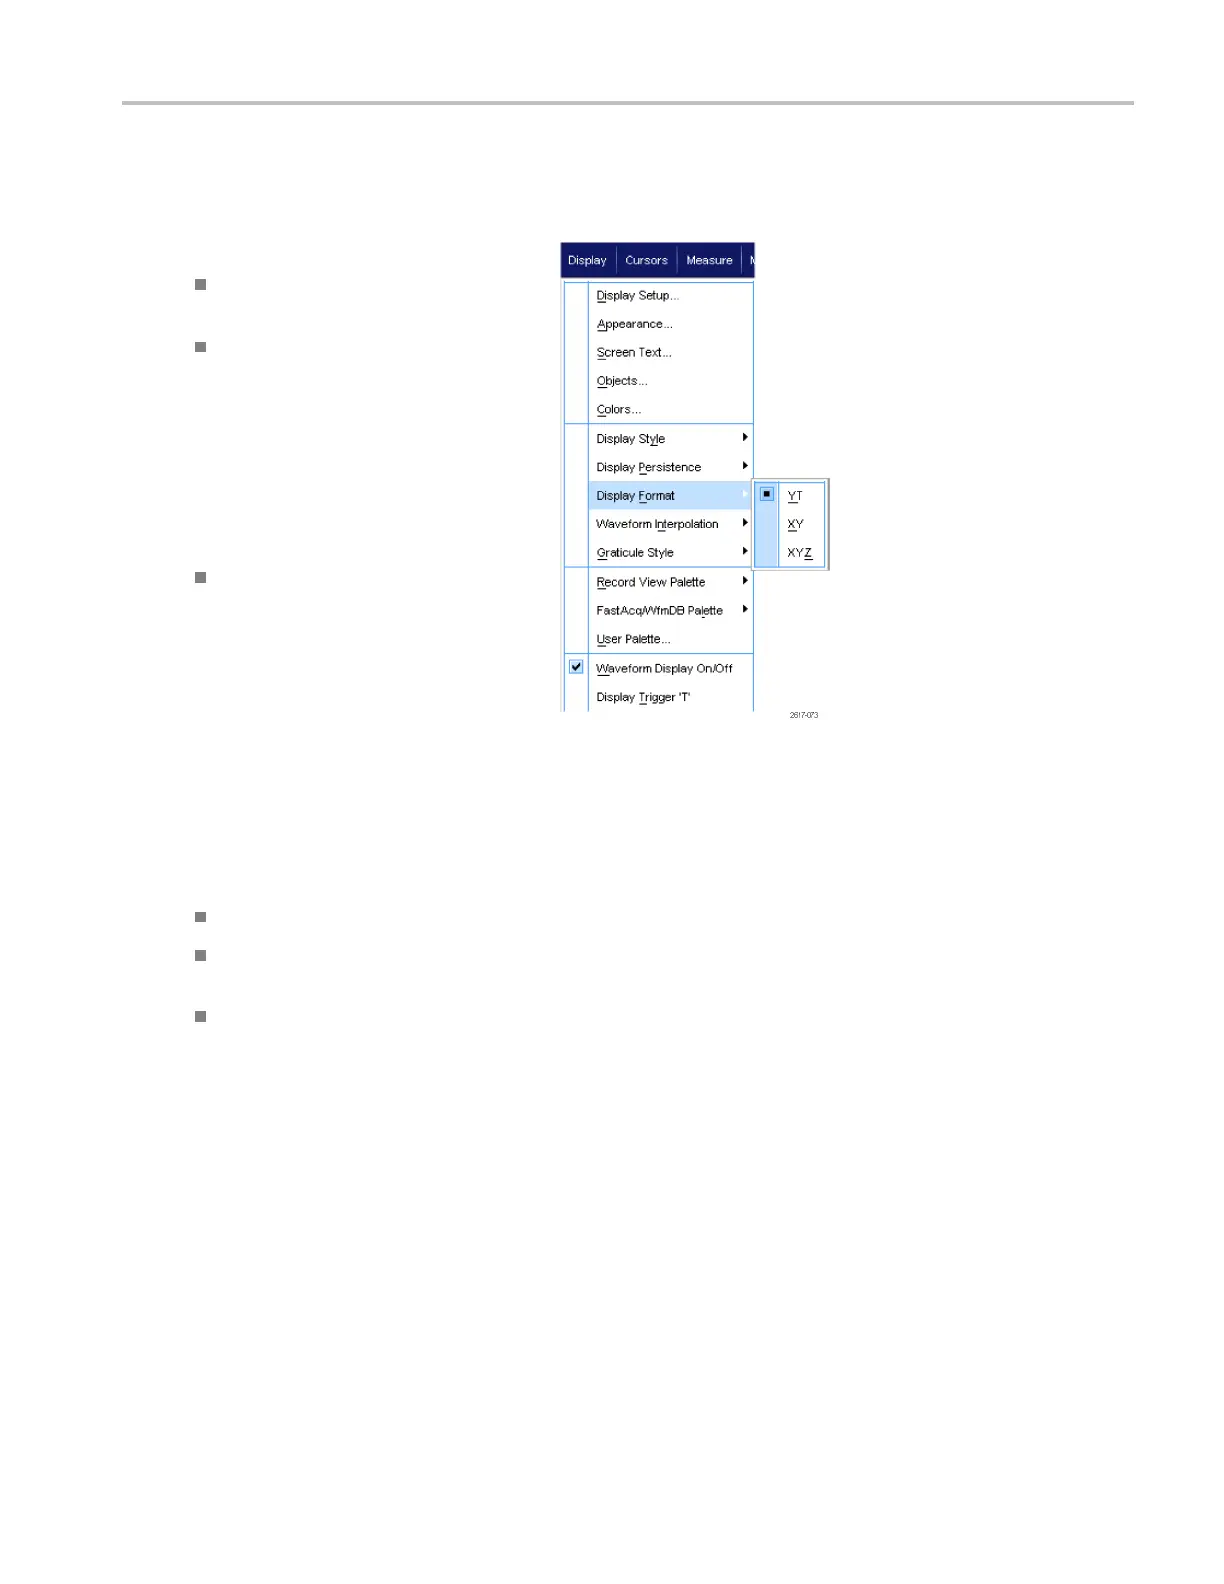
Setting the Display Format
The instrument can display waveforms in two different formats. Choose the format that best suits your needs.
Select Display > Display Format.
Select YT format to show a s ignal
amplitude as it varies over time.
Select XY format to compare the
amplitude of waveform records point by
point:
The following channels are compared:
Ch 1 (X) and Ch 2 (Y),
Ch 3 (X) and Ch 4 (Y),
Ref 1 (X) and Ref 2 (Y),
Ref3(X)andRef4(Y)
Select XYZ format to compare the
voltage levels of the Ch 1 (X) and Ch 2
(Y) w aveform records point by point as
in X Y format. The displayed waveform
intensity is modulated by the Ch 3
(Z) waveform record. XYZ format is
triggered. A -5 division signal (including
position and offset) on Ch 3 produces
a blank screen; a +5 division signal
produces full intensity.
Quick Tips
XY format is particularly useful for studying phase relationships such as Lissajous Patterns.
XY format is a dot-only display, although it can have persist ence. The Vector style selection has no effect when you
selec
tXYformat.
On MS
O5000 and DPO5000 Series instruments, Fast Acq mode is not available in XY or XYZ Display modes.
MSO70000/C, DPO/DSA70000B/C, DPO7000, and MSO/DP O5000 Series U ser M anual 91
 Loading...

