27
G
RAPHING
T
ECHNOLOGY
G
UIDE
: TI-82
Copyright © Houghton Mifflin Company. All rights reserved.
Figure 2.74: Parametric graph of x = cos
3
t and y = sin
3
t
Also look at the new WINDOW menu (Figure 2.73). In the standard window, the values of T go from 0 to 2π in
steps of
π
24
= .1309, with the view from –10 to 10 in both directions. But here the viewing rectangle has been
changed to extend from –2 to 2 in both directions. Press GRAPH to see the parametric graph (Figure 2.74).
You may ZOOM and TRACE along parametric graphs just as you did with function graphs. As you trace along this
graph, notice that the cursor moves in the counterclockwise direction as T increases.
2.8.2 Rectangular-Polar Coordinate Conversion: The 2nd ANGLE menu provides functions for converting
between rectangular and polar coordinate systems. These functions use the current MODE settings, so it is a good
idea to check the default angle measure before any conversion. Of course, you may use the MATH menu to override
the current angle measure setting, as explained in Section 2.4.1. For the following examples, the TI-82 is set to
radian measure.
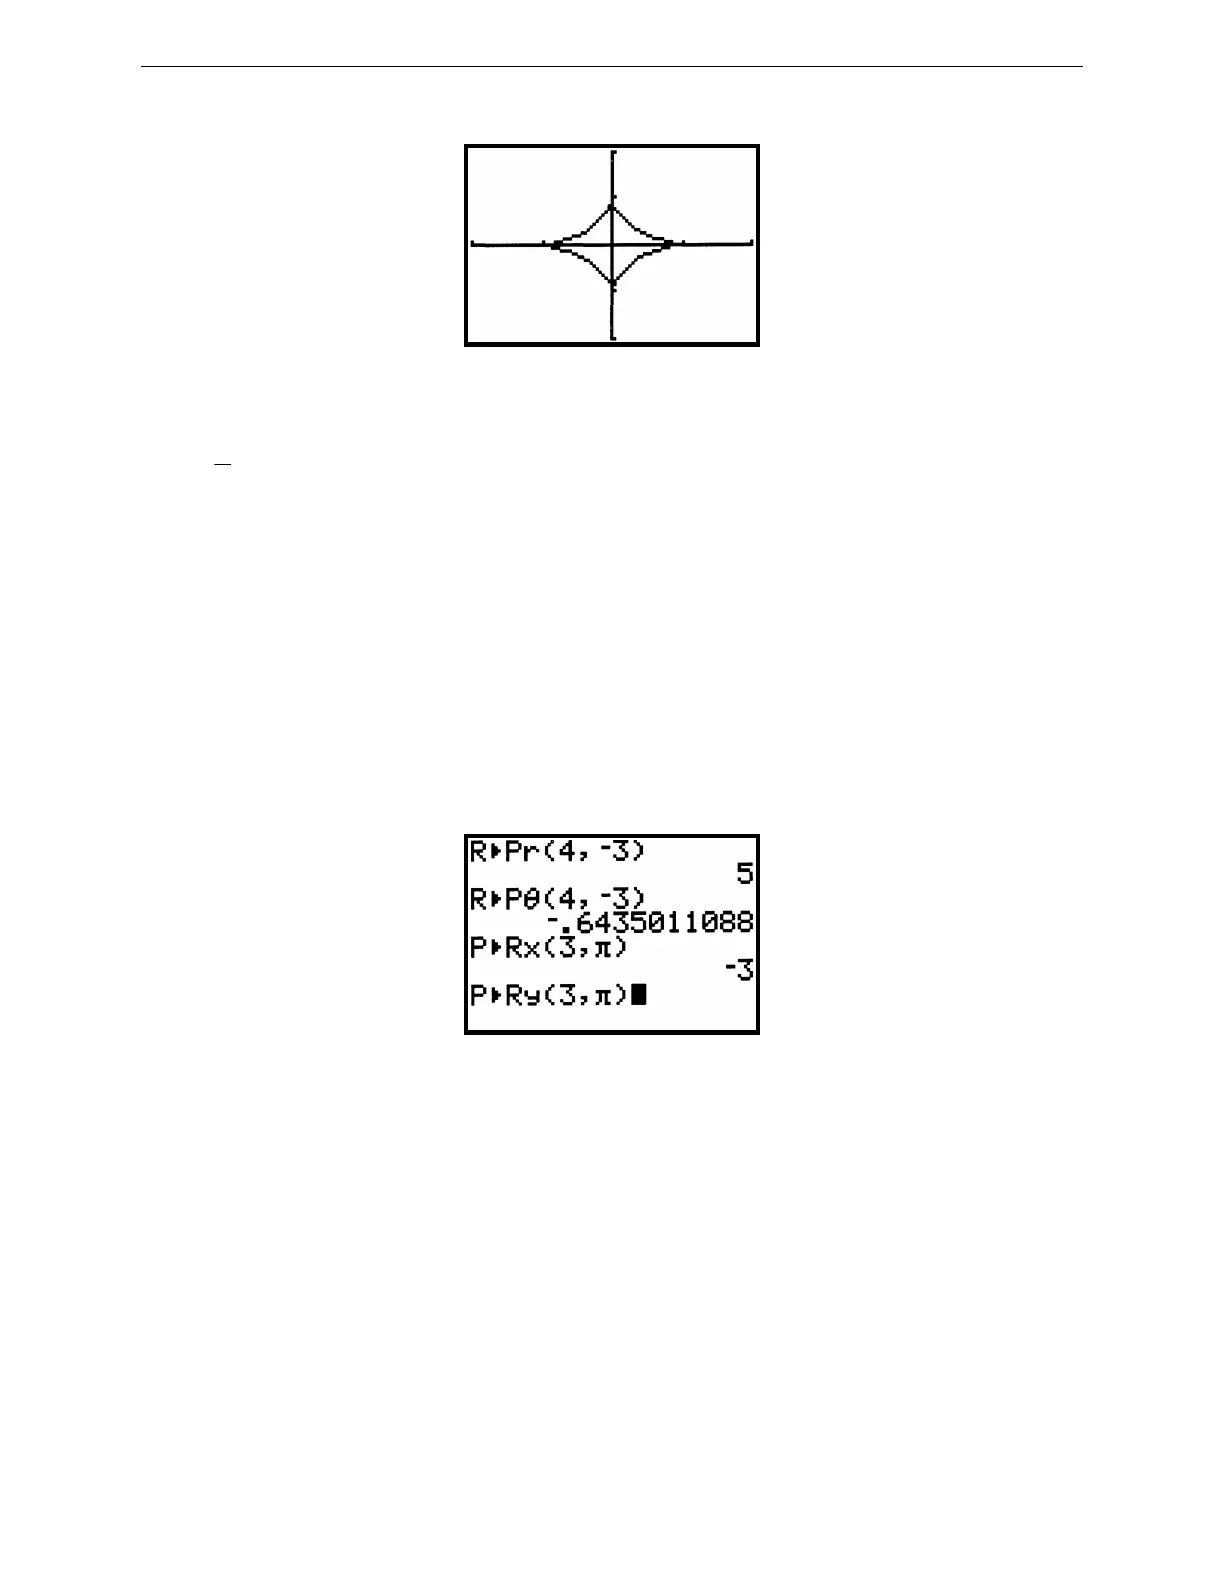
Given rectangular coordinates (x, y) = (4, –3), convert from these rectangular coordinates to polar coordinates (r, θ)
by pressing 2nd ANGLE 5 4 , (-) 3 ) ENTER to display the value of r. The value of θ is displayed after you press
2nd ANGLE 6 4, (-) 3) ENTER.
Figure 2.75: Coordinate conversions
Suppose (r, θ) = (3, π). To convert from these polar coordinates to rectangular coordinates (x, y) , press 2nd
ANGLE 7 3 , 2nd π) for the x-coordinate; next press 2nd ANGLE 8 3 , 2nd π) ENTER to display the y-
coordinate.
2.8.3 Graphing Polar Equations: The TI-82 graphs a polar function in the form r = f (θ). In the fourth line of the
MODE menu, select Pol for polar graphs. You may now graph up to six different polar functions at a time.
For example, to graph r = 4sin θ, press Y= for the polar graph editing screen. Then enter the expression 4sin θ for r1
by pressing 4 sin
X,T,θ
; note that the
X,T,θ
key produces θ in polar mode. Choose a good viewing rectangle and an
appropriate interval and increment for θ. In Figure 2.76, the viewing rectangle is roughly “square” and extends from
–6 to 6 horizontally and from –4 to 4 vertically.

 Loading...


