12 Discovering Algebra Calculator Notes for the Texas Instruments TI-83 and TI-83/84 Plus ©2007 Key Curriculum Press
Note 1C • Median and Mean (continued) TI-83 and TI-83/84 Plus
(continued)
Use the down arrow to display the entire list of values.
x
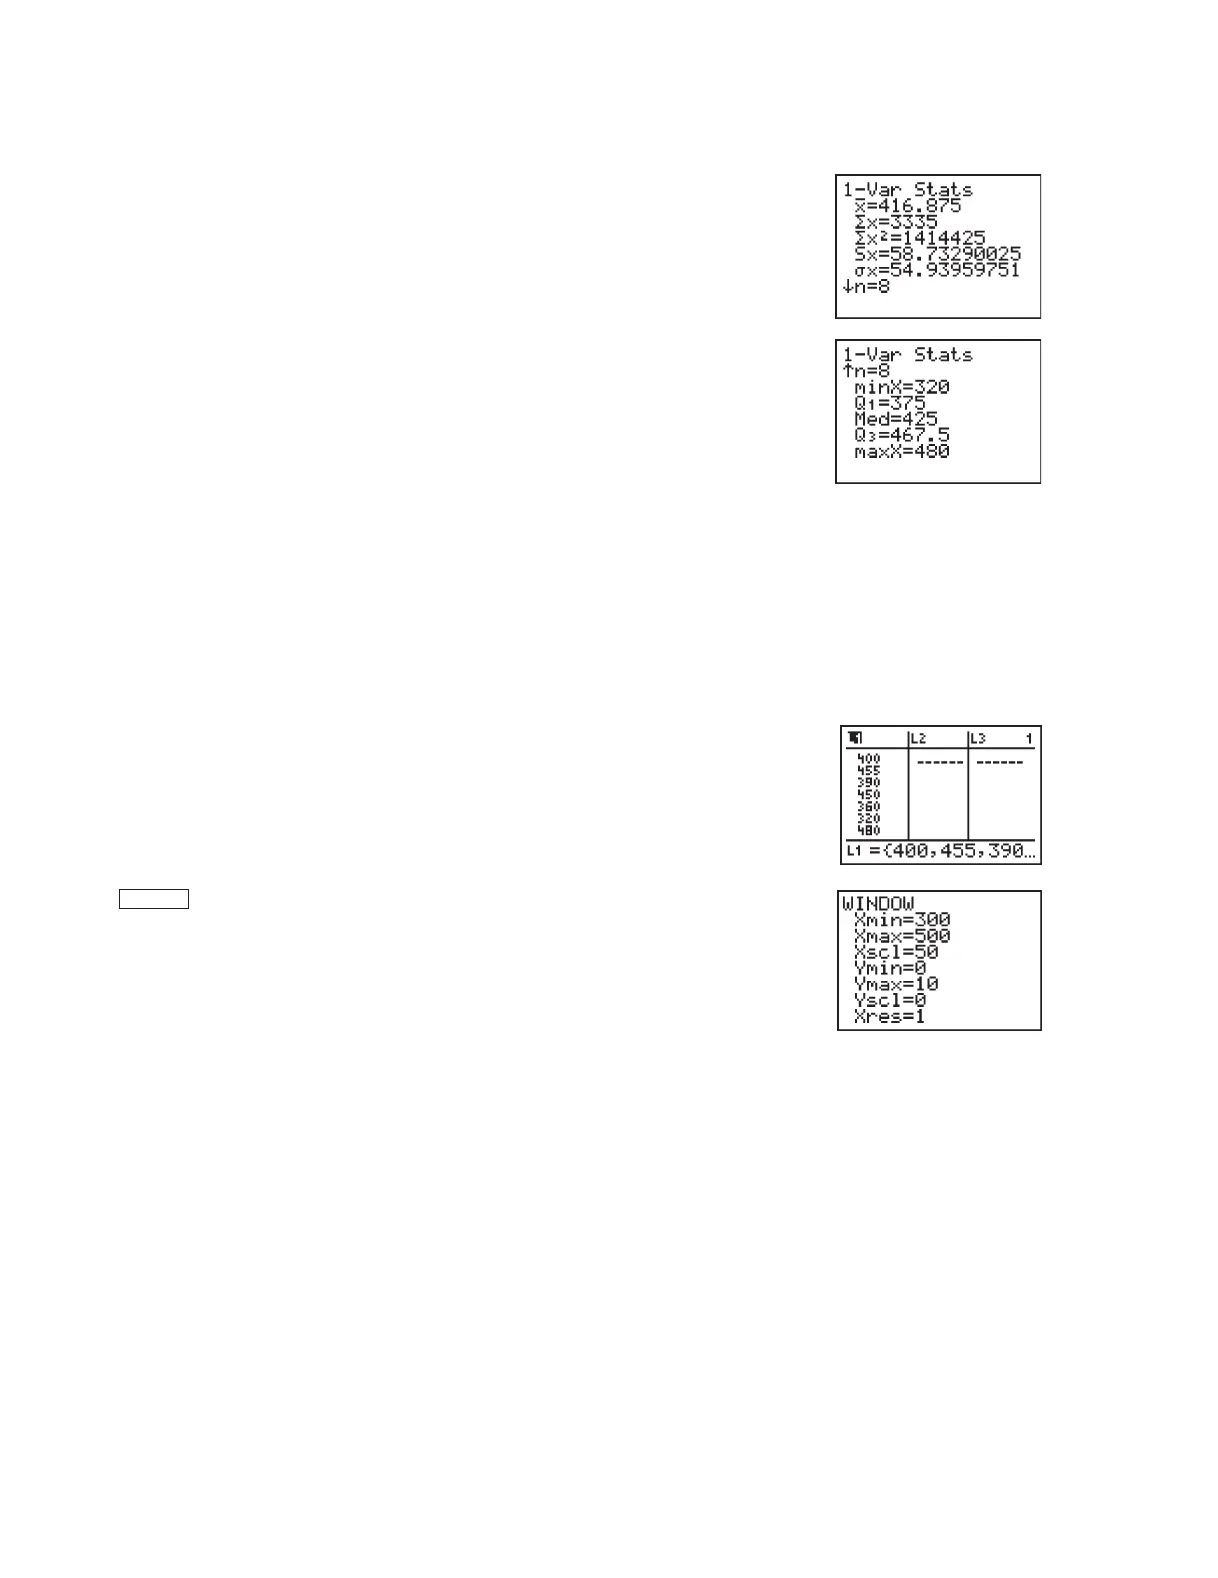
416.875 the mean
x 3335 the sum of the x-values
x
2
1414425 the sum of the squares of the x-values
Sx 58.73290025 the sample standard deviation
x 54.93959751 the population standard deviation
n 8 the number of data values
minX 320 the minimum data value
Q1 375 the first quartile
Med 425 the median
Q3 467.5 the third quartile
maxX 480 the maximum data value
Errors
If you select 1–Var Stats and forget to enter the list name, the calculator default
will be list
L1.Ifyou get ERR:INVALID DIM,you have selected a blank list.
Note 1D • Box Plots
Entering the Data
Enter the data set into a list. List L1 is used for this example. (See Note 1B if you
need help entering data.)
Setting the WINDOW Values
Press and enter the following values into the WINDOW screen.
Xmin a number slightly less than the minimum of the data.
Xmax a number slightly greater than the maximum of the data.
Xscl the distance between tick marks. Although this number is not
critical to graphing a box plot, if it’s too small, the tick marks will
make the x-axis appear too thick.
Ymin 0.
Ymax 10. This number is not important for a box plot. Any number
greater than Ymin will work.
Yscl 0. This number does not affect a box plot.
Xres 1. This number does not affect a box plot.
WINDOW
DA2CN_773_01.qxd 10/19/05 9:53 Page 12

 Loading...


