©2007 Key Curriculum Press Discovering Algebra Calculator Notes for the Texas Instruments TI-83 and TI-83/84 Plus 13
Note 1D • Box Plots (continued) TI-83 and TI-83/84 Plus
(continued)
Displaying the Box Plot
This example uses the data in list L1,but you can choose any list.
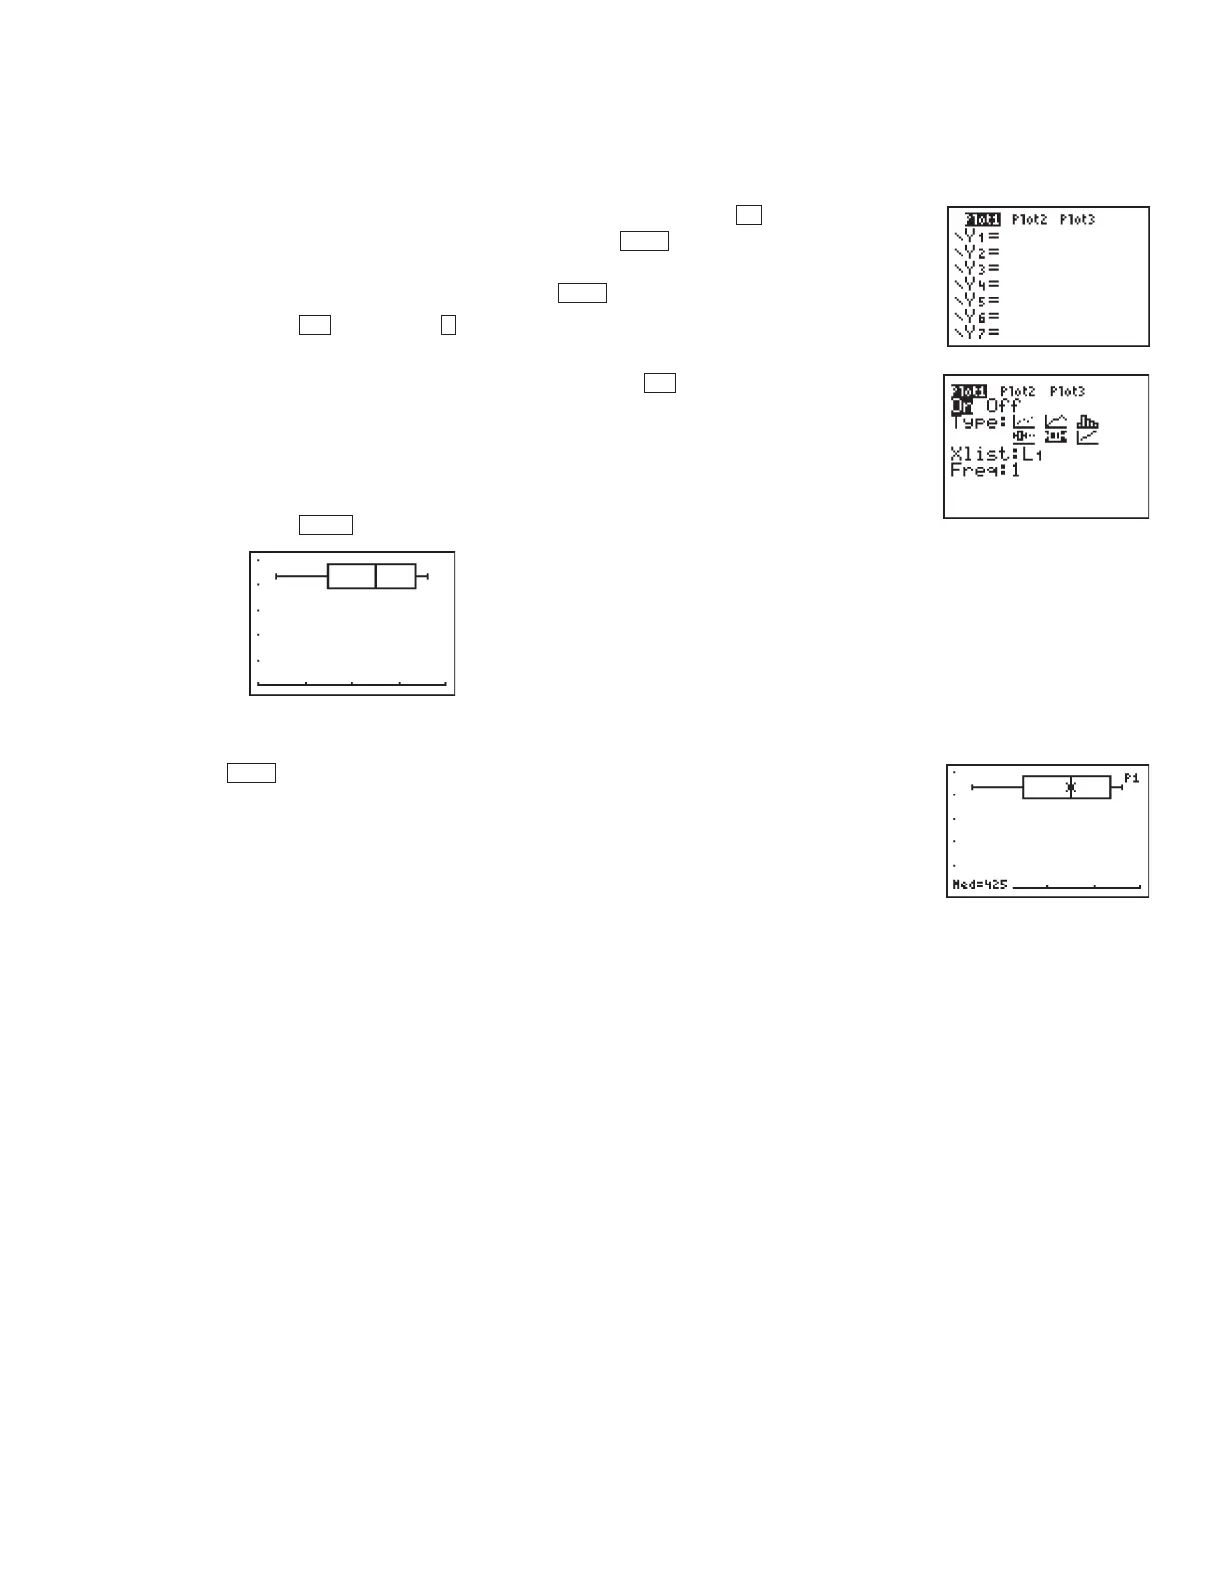
a. Clear or turn off any equations in the
Y screen. (Press . Place the
cursor anywhere in an equation and press to delete the equation.
Or, move the cursor over the highlighted equal sign of any equation
you don’t want to delete, and press to turn off the equation.)
b. Press
[STAT PLOT] (Plot1...).(You can choose any of the three
stat plots.)
c. Select
On, Box Plot, L1, 1.(To select list L1 press [L1].)
Note that there are two types of box plots available. The first type will
not connect outliers to the rest of the plot. The second type will. If you
choose the first type, you will also have to indicate the mark you want
to use for any outlying points.
d. Press .
Tracing on a Box Plot
Press . The trace option allows you to see the five number summary
values for the box plot by pressing the left and right arrows. If you press the up
and down arrows, you move from one box plot to another. (See the Graphing
More Than One Box Plot section that follows.) Look in the upper-left corner
of the calculator screen to see which plot the calculator is tracing. The trace
option always starts with the stat plots and then moves to equations on the
Y screen (if any are turned on), even if you can’t see them in the current
window. Be sure to turn off any plots and any equations you do not want to
see or trace.
Graphing More Than One Box Plot
The calculator can graph up to three box plots at the same time. Follow the
directions for making a box plot and set up
Plot2, Plot3,or both. Be sure the list
in which you’ve entered the data matches the list you select when setting up
each box plot.
Errors
If you don’t see a graph, then check the Xmin and Xmax values to make sure
that your data lies between them. If you get
ERR:INVALID DIM when you try to
TRACE
GRAPH
2nd
12nd
ENTER
CLEAR
Y
DA2CN_773_01.qxd 10/19/05 9:53 Page 13

 Loading...


