14 Discovering Algebra Calculator Notes for the Texas Instruments TI-83 and TI-83/84 Plus ©2007 Key Curriculum Press
Note 1D • Box Plots (continued) TI-83 and TI-83/84 Plus
graph, you have selected a blank list. If you get ERR:WINDOW RANGE,you have
probably assigned an Xmax value that is less than the Xmin value or a Ymax
value that is less than the Ymin value.
Clean-up
When you are finished graphing box plots, you might want to turn off
all the plots so that they don’t interfere with other graphing screens.
Press
[STAT PLOT] (PlotsOff) , or press , arrow to any plot
that is highlighted, and press .
Note 1E • Histograms
Entering the Data
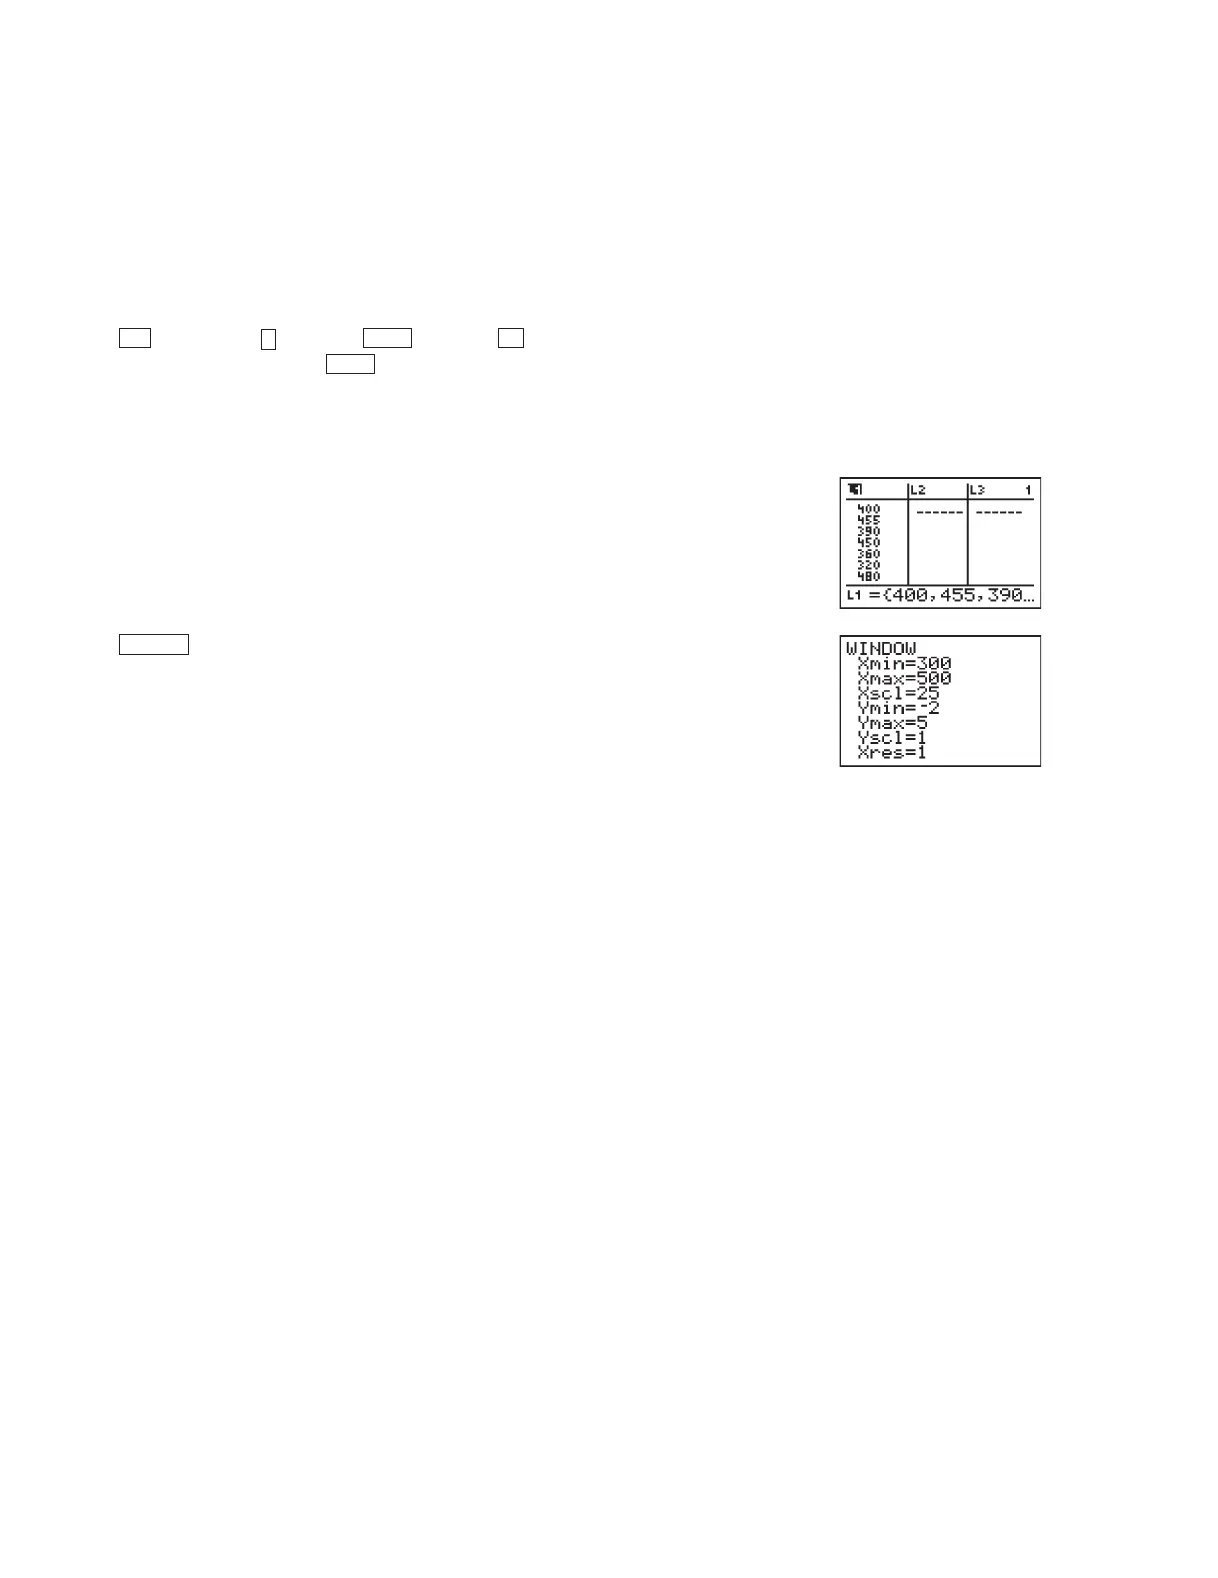
Enter the data into a list. List L1 is used for this example. (See Note 1B if you
need help entering the data.)
Setting the WINDOW Values
Press and enter the following values into the WINDOW screen.
Xmin a number equal to or slightly less than the minimum of the data.
Xmax a number greater than the maximum of the data.
Xscl the width of each bar. Use an integer value that is approximately
equal to
Xmax
8
Xmin
.
Ymin 2. Using a negative value for Ymin allows you to trace on the
graph without the trace values interfering with the graph itself.
Ymax the height of the tallest bar. Make an intelligent guess. You may have
to revise this value when you look at the graph. Tracing on the
graph can help you determine the maximum bar height.
Yscl the distance between tick marks on the y-axis. The number you
choose will depend on the Ymax value. You don’t want tick marks
that are too close together, or the y-axis will appear too thick.
Xres 1. This number does not affect a histogram.
The Xscl value determines the width of the histogram bars. You may need to
extend the range one bar-width beyond what you think it should be by
increasing the Xmax value. You may want to create a histogram with as few as
five or as many as ten bars. Experiment with different values for Xscl to see
what effect each has on the graph.
WINDOW
ENTER
Y
ENTER
4
2nd
(continued)
DA2CN_773_01.qxd 10/19/05 9:53 Page 14

 Loading...


