A
[bar]
T
[bar]
50
40
30
35
25
20
15
10
5
32
6
31,5
36
q
Vmax
0
60
0510 17
1
2
3
4
5
6
7
10/12
DBD | Pressure relief valve
Bosch Rexroth AG, RE 25710, edition: 2016-07
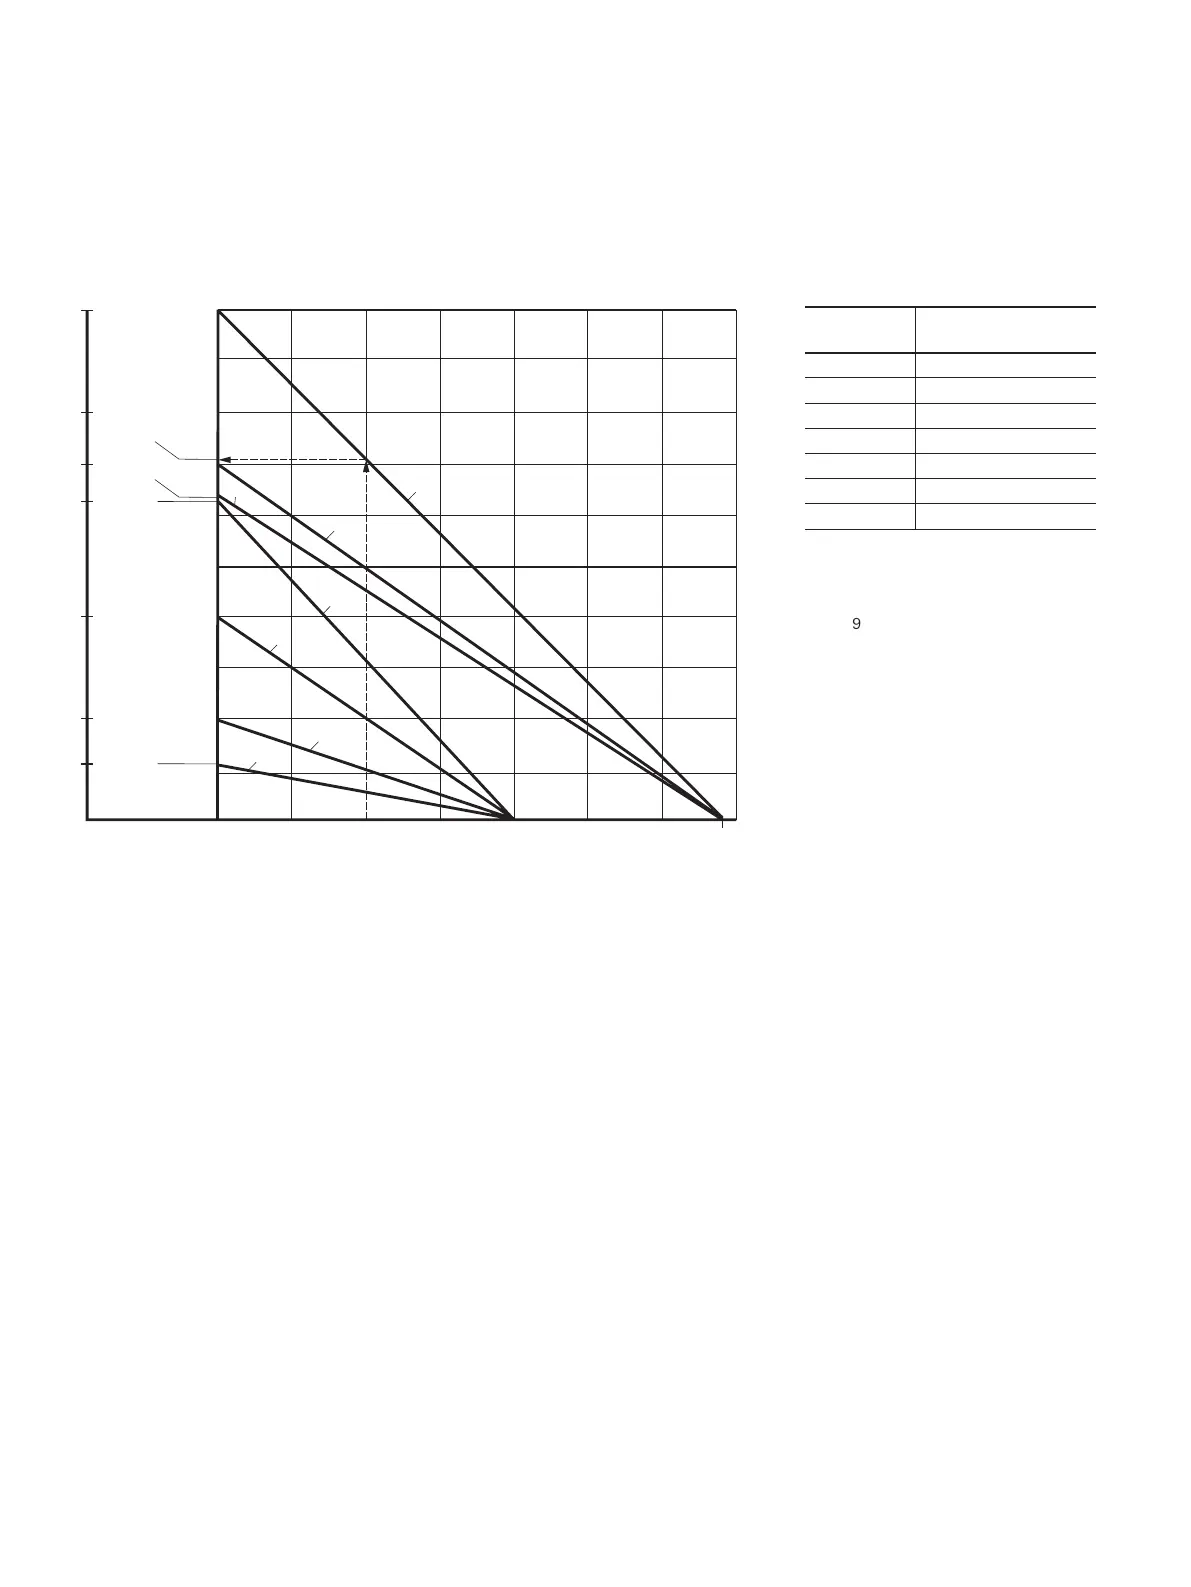
Characteristic curves: Counter pressure in the discharge line
Diagram for determining the maximum counter pressure p
T
in the discharge line at port T of the valve dependent on the
flow q
Vmax
for valves DBD. 4...1X/...E with different response pressures p
A
.
p
A
Response pressure in bar
p
T
Maximum counter pressure in the discharge line (port T)
inbar
q
Vmax
Maximum flow in l/min
Determination of the maximum counter pressure
Example (with already existing characteristic curve):
Flow of the system / accumulator to be secured: q
Vmax
= 5 l/min
Safety valve set to: p
A
= 500 bar.
Read off the maximum counter pressure p
T
of approx. 36 bar from
the diagram (see arrows, characteristic curve 7).
Characteristic
curves
Response pressure p
A
in bar
1 60
2 100
3 200
4 315
5 320
6 350
7 500
Characteristic curves for
intermediate values can be generated
by interpolation. Further
explanations can be found on
page9.
 Loading...