Results:
Results:
Mean: 3, Population Standard Deviation: 1.154700538
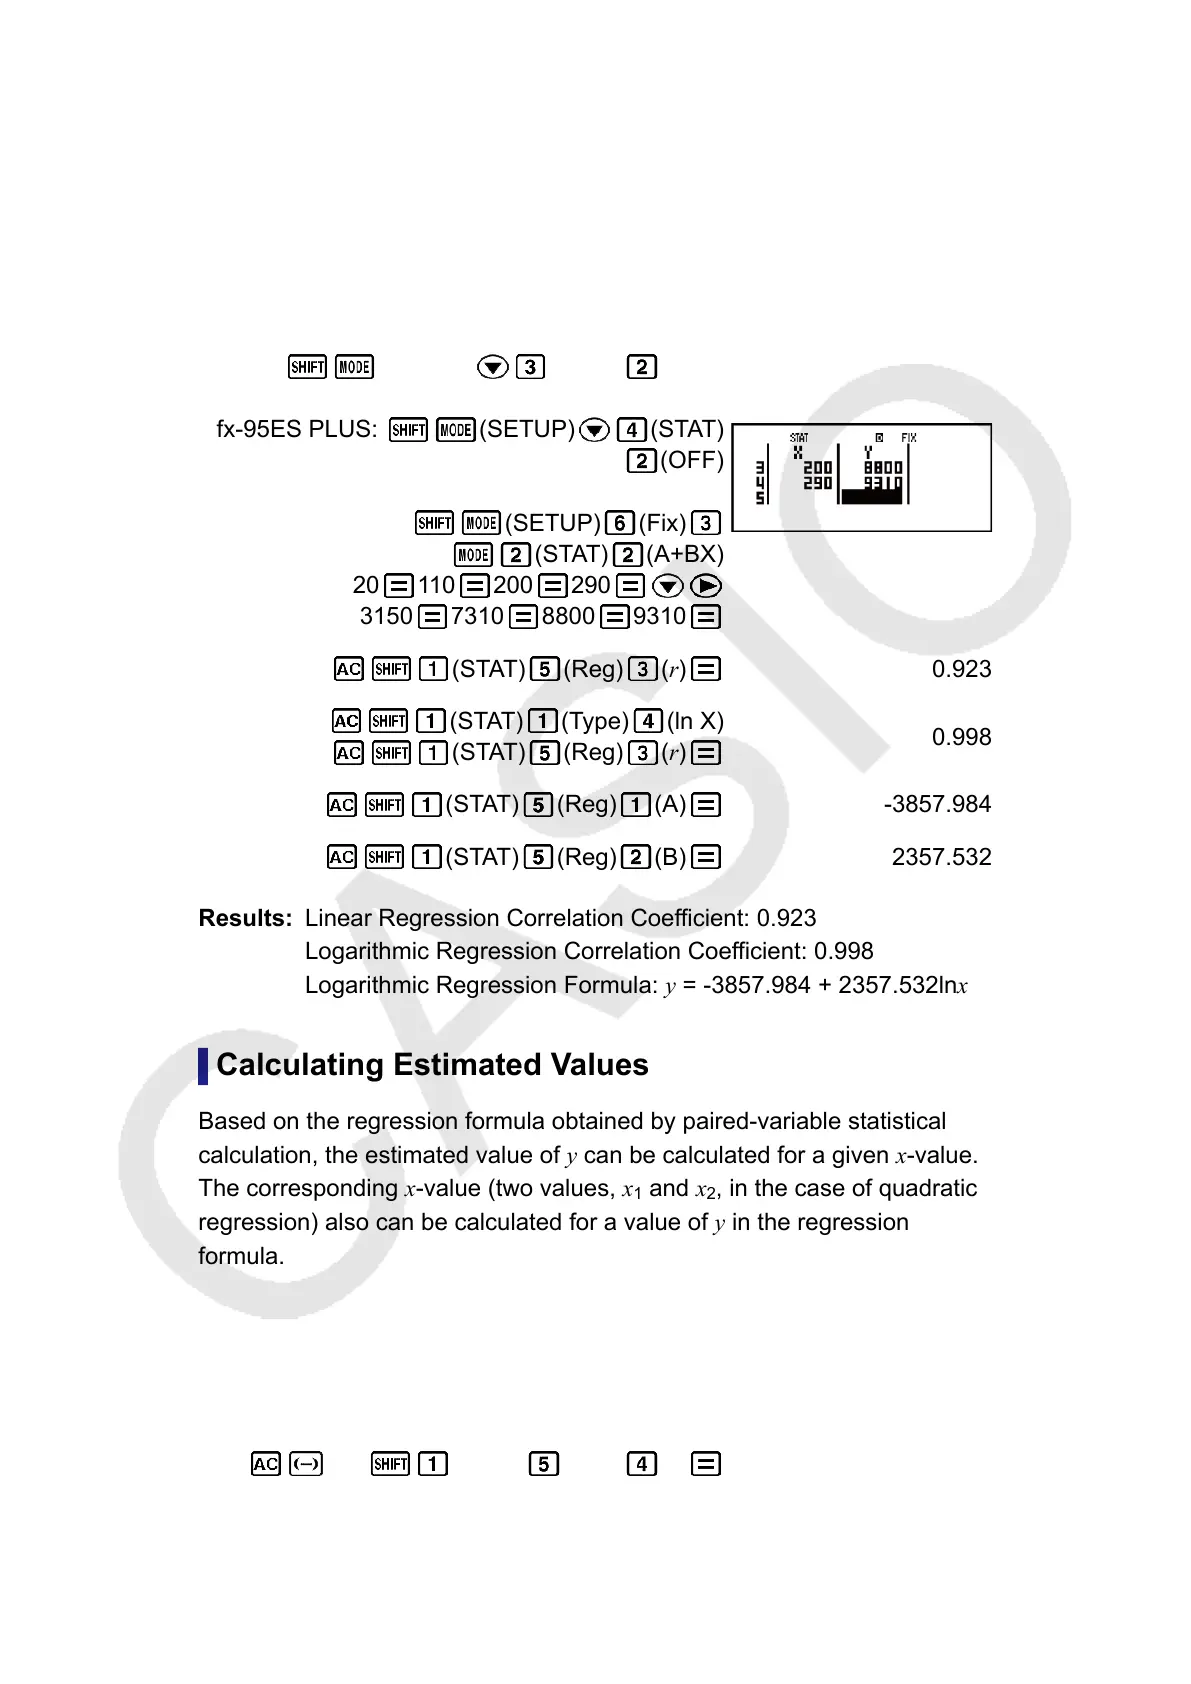
Example 3: T
o calculate the linear regression and logarithmic regression
correlation coefficients for the following paired-variable data and determine
the regression formula for the strongest correlation: (x, y) = (20, 3150),
(110, 7310), (200, 8800), (290, 9310). Specify Fix 3 (three decimal places)
for results.
fx-82ES PLUS/fx-85ES PLUS/fx-350ES PLUS:
(SETUP) (STAT) (OFF)
fx-95ES PLUS: (SETUP) (STAT)
(OFF)
(SETUP) (Fix)
(STAT) (A+BX)
20 110 200 290
3150 7310 8800 9310
(STAT) (Reg) (r)
0.923
(STAT) (Type) (ln X)
(STAT) (Reg) (r)
0.998
(STAT) (Reg) (A) -3857.984
(STAT) (Reg) (B) 2357.532
Linear Regression Correlation Coefficient: 0.923
Logarithmic Regression Correlation Coef
ficient: 0.998
Logarithmic Regression Formula: y = -3857.984 + 2357.532lnx
Calculating Estimated Values
Based on the regression formula obtained by paired-variable statistical
calculation, the estimated value of y can be calculated for a given x-value.
The corresponding x-value (two values, x
1
and x
2
, in the case of quadratic
regression) also can be calculated for a value of y in the regression
formula.
Example 4: T
o determine the estimate value for x when y = -130 in the
regression formula produced by logarithmic regression of the data in
Example 3. Specify Fix 3 for the result. (Perform the following operation
after completing the operations in Example 3.)
130 (STAT) (Reg) (xˆ)
4.861
43
 Loading...