(Regression)(r)
0.998
(Regression)(a)
-3857.984
(Regression)(b)
2357.532
Calculating Estimated Values
Based on the regression formula obtained by paired-variable statistical
calculation, the estimated value of y can be calculated for a given x-value.
The corresponding x-value (two values, x
1
and x
2
, in the case of quadratic
regression) also can be calculated for a value of y in the regression formula.
Ex 4: To determine the estimate value for y when x = 160 in the regression
formula produced by logarithmic regression of the data in Ex 3. Specify Fix
3 for the result. (Perform the following operation after completing the
operations in Ex 3.)
160(Regression)(
𝑦
)
8106.898
Important: Regression coefficient, correlation coefficient, and estimated
value calculations can take considerable time when there are a large
number of data items.
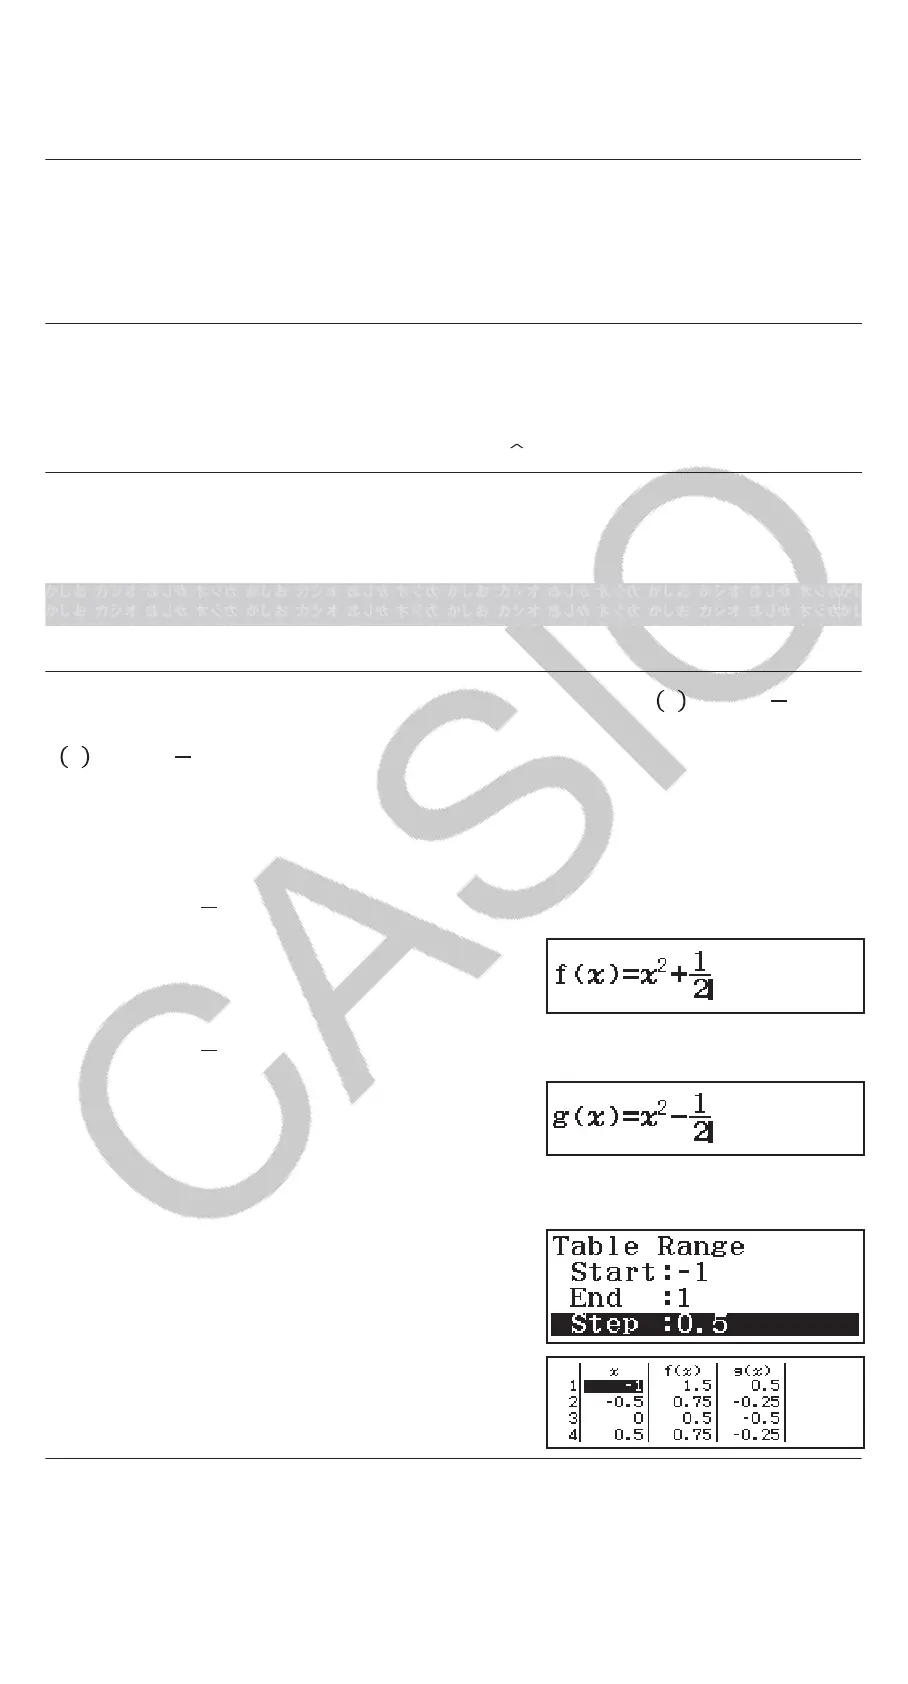
Creating a Number Table
The Table Mode generates a number table based on one or two functions.
Example: To generate a number table for the functions 𝑓
𝑥 =𝑥
2
+
1
2
and
g
𝑥 =𝑥
2
−
1
2
for the range
-1 ≦ 𝑥 ≦ 1, incremented in steps of 0.5
1. Press , select the Table Mode icon, and then press .
2. Configure settings to generate a number table from two functions.
(SETUP)(Table)(f(x),g(x))
3. Input
𝑥
2
+
1
2
.
(x)12
4. Input 𝑥
2
−
1
2
.
(x)12
5. Press . On the Table Range dialog box that appears, input values for
Start (Default: 1), End (Default: 5), and Step (Default: 1).
110.5
6. Press to generate the number table.
• Press to return to the screen in
step 3.
Tip
• In the number table shown in step 6, you can change the value in the
currently highlighted x cell. Changing the x value causes the f(x) and g(x)
values in the same line to be updated accordingly.
17
 Loading...