GRAPH-MODIFY
1. Explore how the graph of the function y = Ax + B changes for different values of A and B.
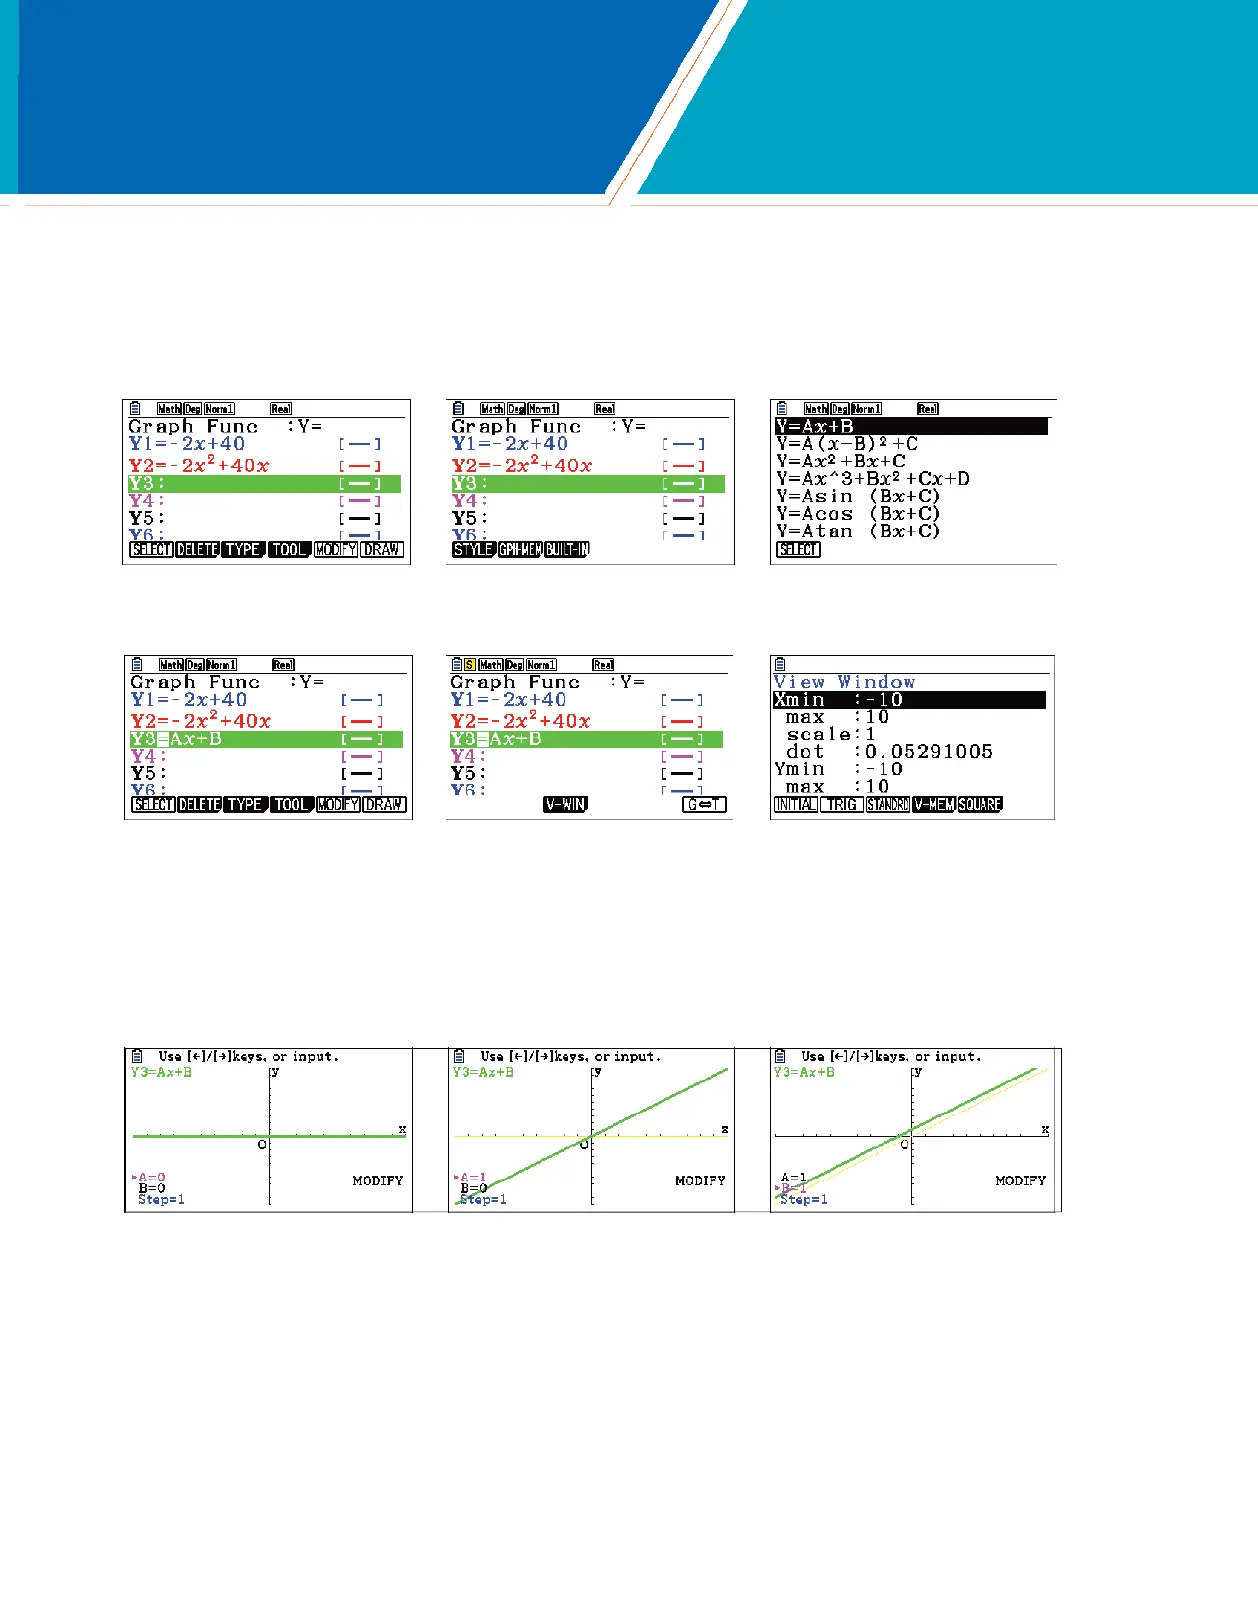
From the Main Menu, press 5. Use q(SELECT) to deselect any functions and N to move to a new line; in this screen shot, it is Y3. Press r(TOOL)I
(BUILT-IN). With Y=Ax+B, highlighted, press q(SELECT).
To use a standard window, press LI (V-Window)I (STANDRD)d.
Press y(MODIFY). A graph is drawn based on values stored to A and B. Values for the variables are displayed in the lower left portion of the screen. The active
value is magenta, in this case, A. Press c to increase A by the value shown as Step. Press ! to decrease A. Alternately, press any number keys to change the
value of A. A dialogue box opens displaying the new desired value, then, press l. Notice, the previous graph is drawn in faint yellow. Use NB to change the value
of a different variable or the value for Step.
fx-CG50 Quick Start Guide 11

 Loading...