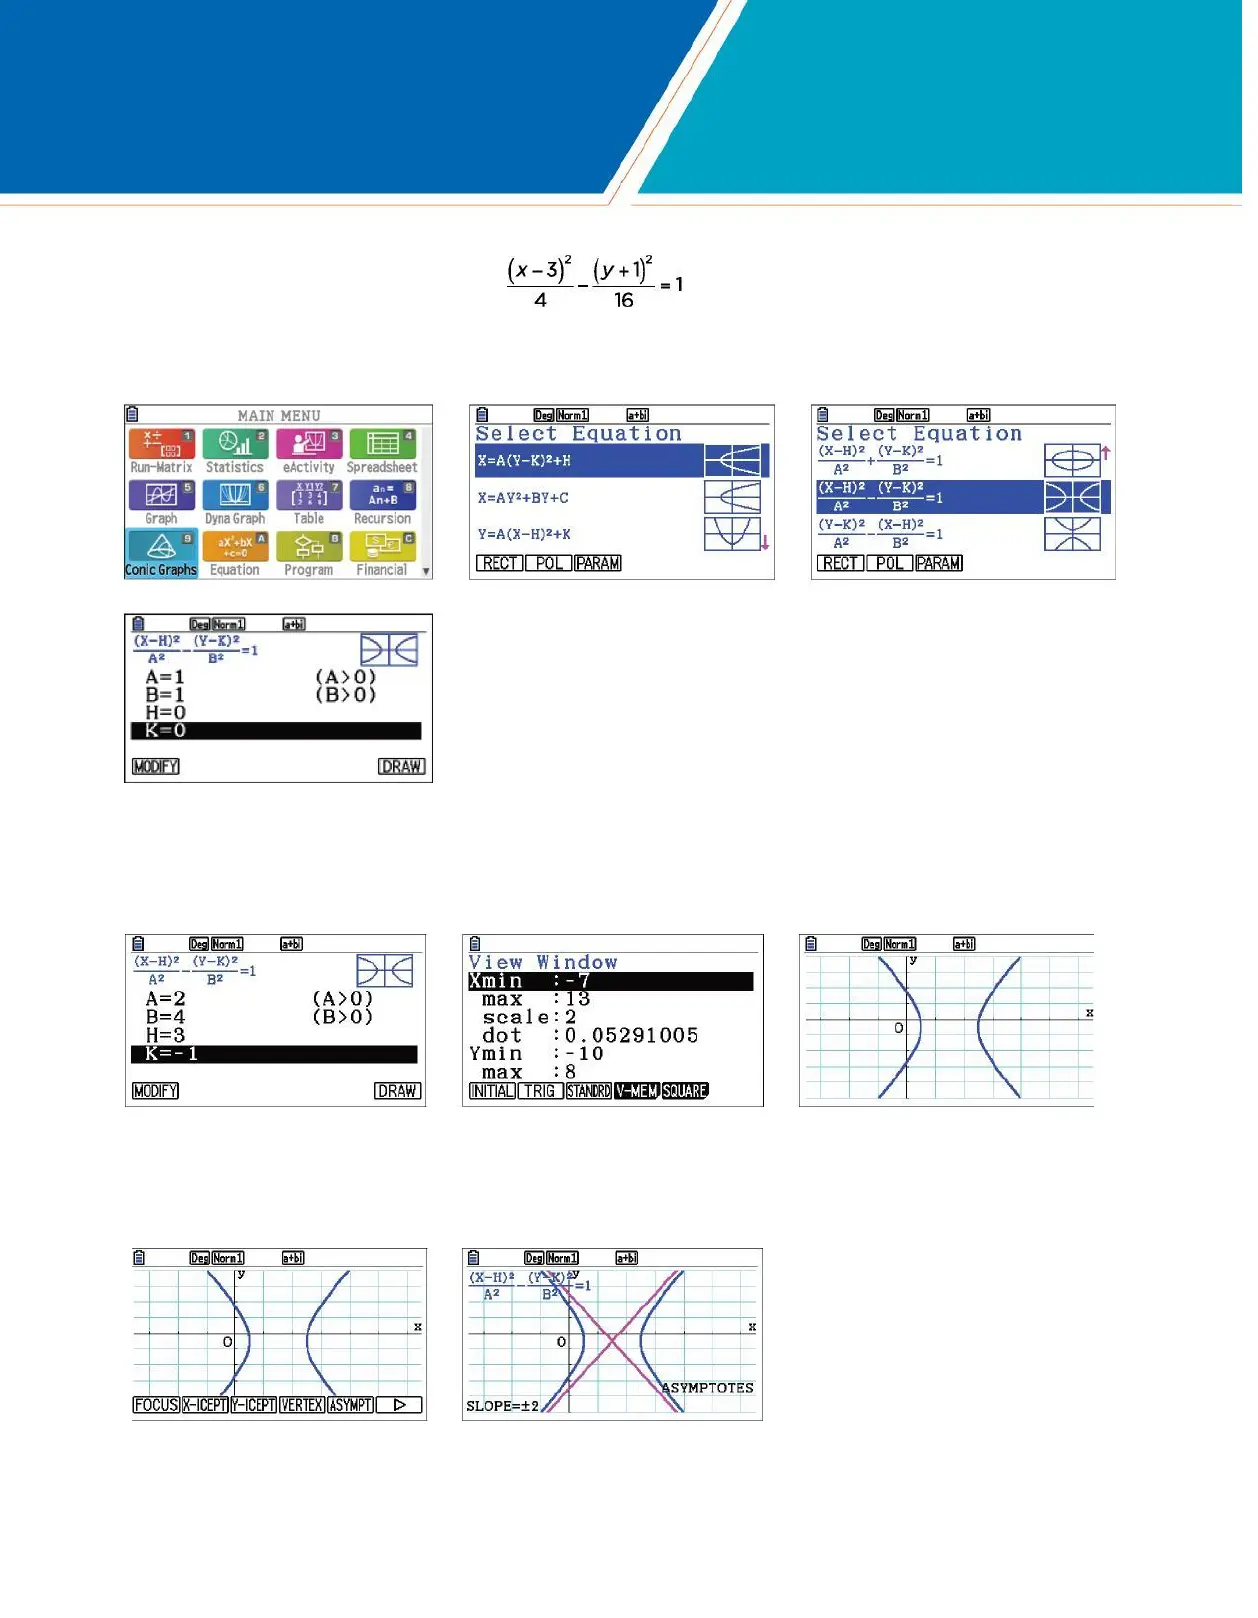
1. Construct the graph of the conic section .
CONICS
From the Main Menu, press 9. Scroll down to the correct form and press l.
Enter the correct values. Note, the exponents in the denominators, so A = 2, rather than 4. Also, note the minus signs
in the numerator, so H = 3 and K = -1. Press l after each value. As before, press Le(V-Window)
to change the values for the window, then press d. To draw the graph, press u(DRAW).
2. Find the asymptotes for the conic graph.
To draw the asymptotes, press Ly(G-Solv)y(ASYMPT). The slope for each line is also displayed.
14 fx-CG50 Quick Start Guide

 Loading...