GRAPH
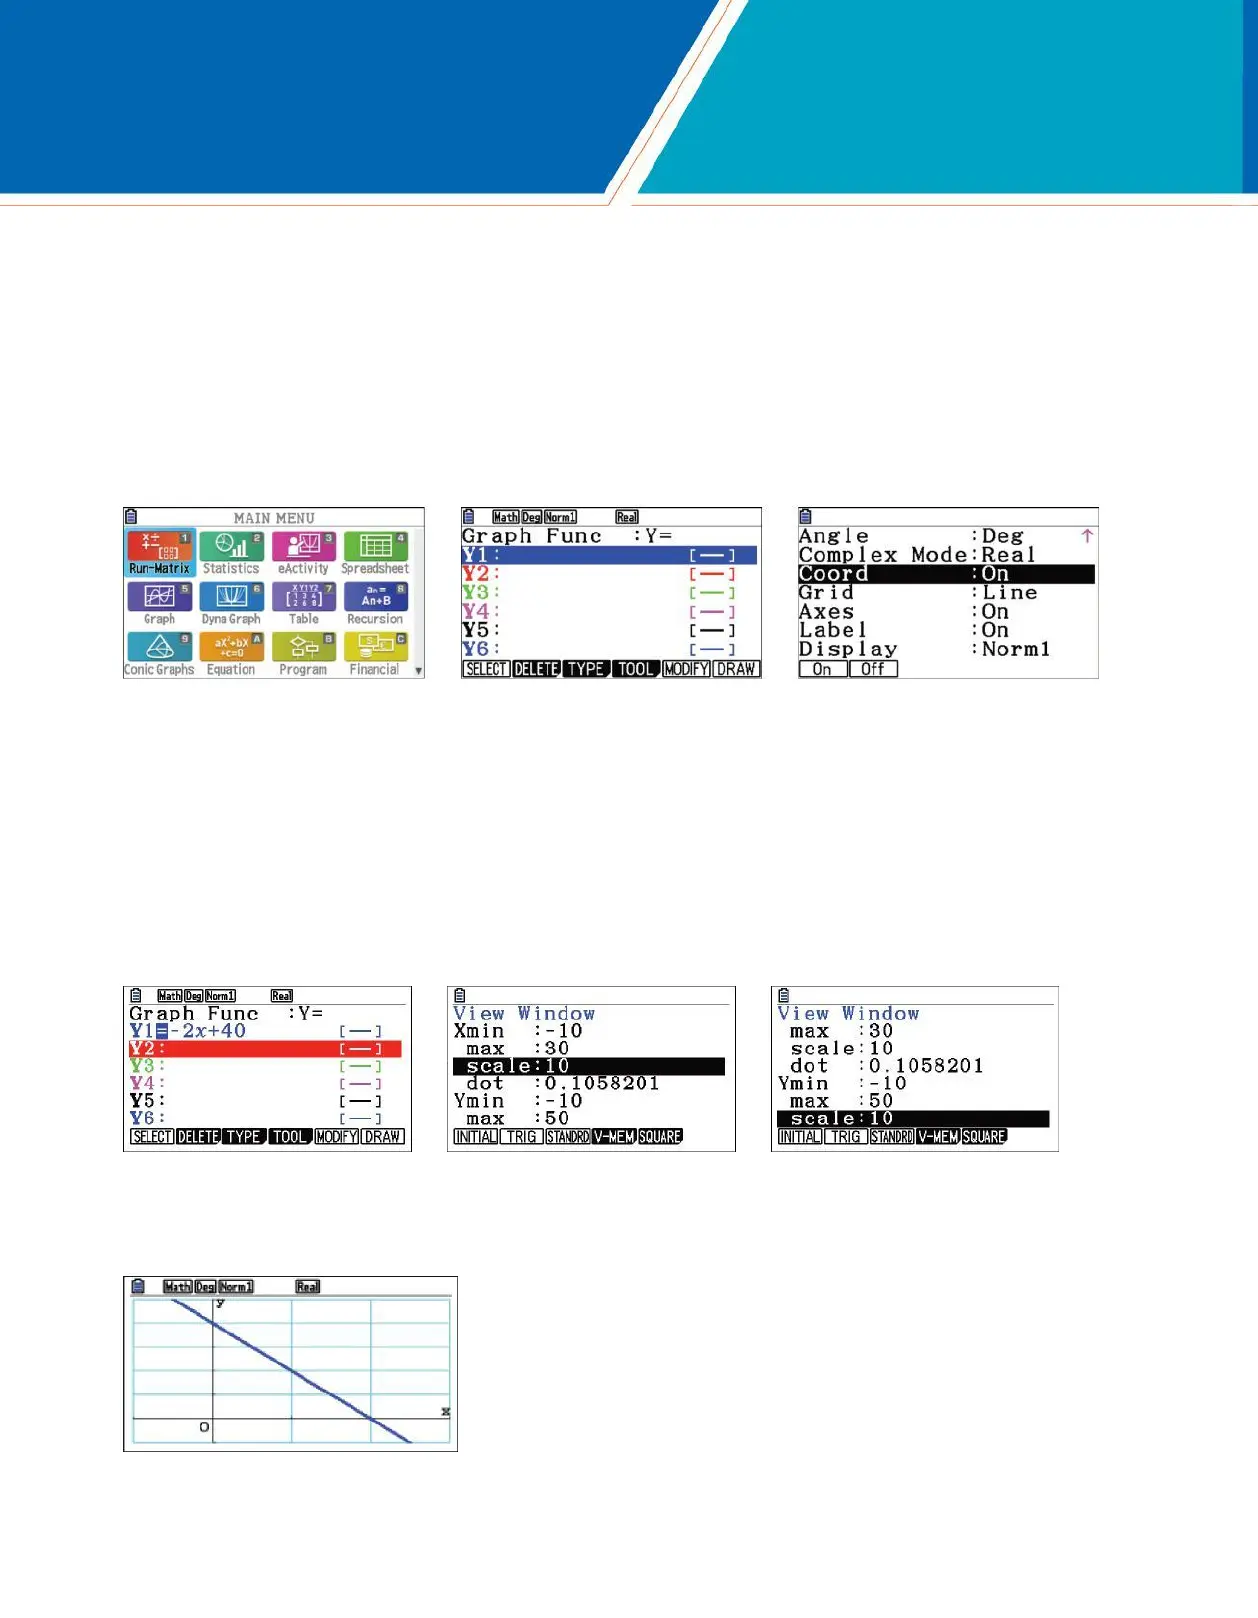
To construct graphs and use graphical analysis commands, use the Graph menu. From the Main Menu, press 5.
The first screen is the function/relation editor. To select how certain results will be displayed, press Lp
(SET UP). The suggested selections for Coord, Grid, Axes and Label are shown. Scroll down to these selections.
To make a change, highlight the item and use the function button that appears directly below the desired tab. For
example, when Coord is highlighted, q(On) will turn coordinates on and w(Off) will turn coordinates off.
Press d to return to the editor.
The Math Club plans to sell t-shirts. Previous experience suggests that the number of t-shirts sold depends on the price. A good model for the number sold,
y, as a function of the price, x, is y = -2x + 40.
1. Construct a graph of this equation.
To construct a graph of this model, press n2f+40l. To select the view window, press Le(V-Window). Change the values for the window, as
shown, pressing l after each value. The values for Scale determines the location for the marks on the axes and the gridlines. Press d to
return to the editor.
To draw the graph, press u(DRAW). When a graph is displayed the + key can be used to zoom in, the - key to zoom out,
and$!BN to scroll.
6 fx-CG50 Quick Start Guide

 Loading...