Dashboard
System Health
32 Cisco 350, 350X and 550X Series Managed Switches, Firmware Release 2.4, ver 0.4
3
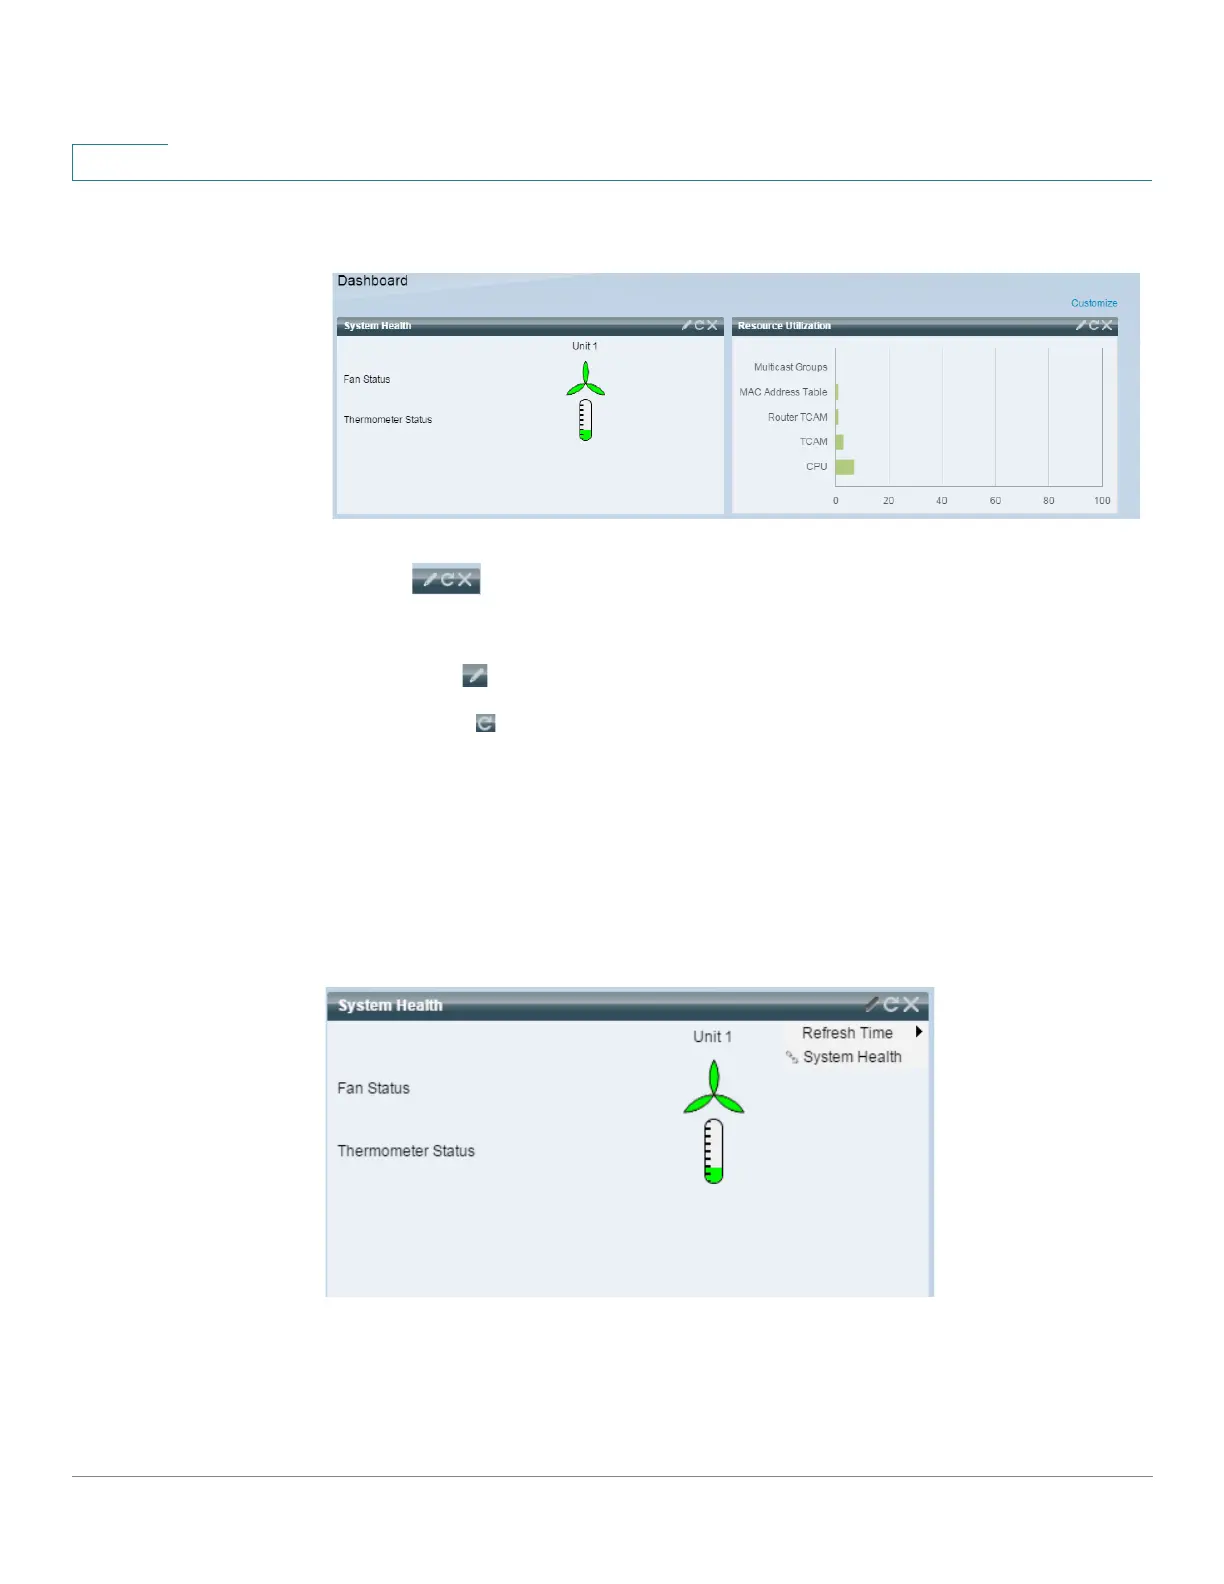
Only when you click Done (in the right-hand corner), are the modules populated by the
relevant information, as shown below:
The title bar of each module in the dashboard displays the title of the module and three
buttons:
These button perform the following:
• Pencil — Opens configuration options (depending on the module).
• Refresh — Refreshes the information.
• X — Removes the module from the dashboard.
System Health
This module displays information about device temperature (when such information is
available) for a standalone device or for each device in the stack, as shown below:
The following icons are shown:
• Fan Status—Yellow if one fan failed and is backed up by the redundant fan; Green if
the fan is operational; Red if the fan is faulty.
 Loading...