Dashboard
Resource Utilization
23 Cisco Sx350, SG350X, SG350XG, Sx550X & SG550XG Series Managed Switches, Firmware Release 2.2.5.x
2
• Thermometer Status
- Temperature is OK—Green with a nearly empty thermometer.
- Temperature generates a warning—Yellow with a half full thermometer.
- Temperature is critical—Red with a full thermometer.
The following configuration options (pencil icon in upper right-hand corner) are available:
• Refresh Time—Select one of the options displayed.
• System Health—Click to open the Health and Power page.
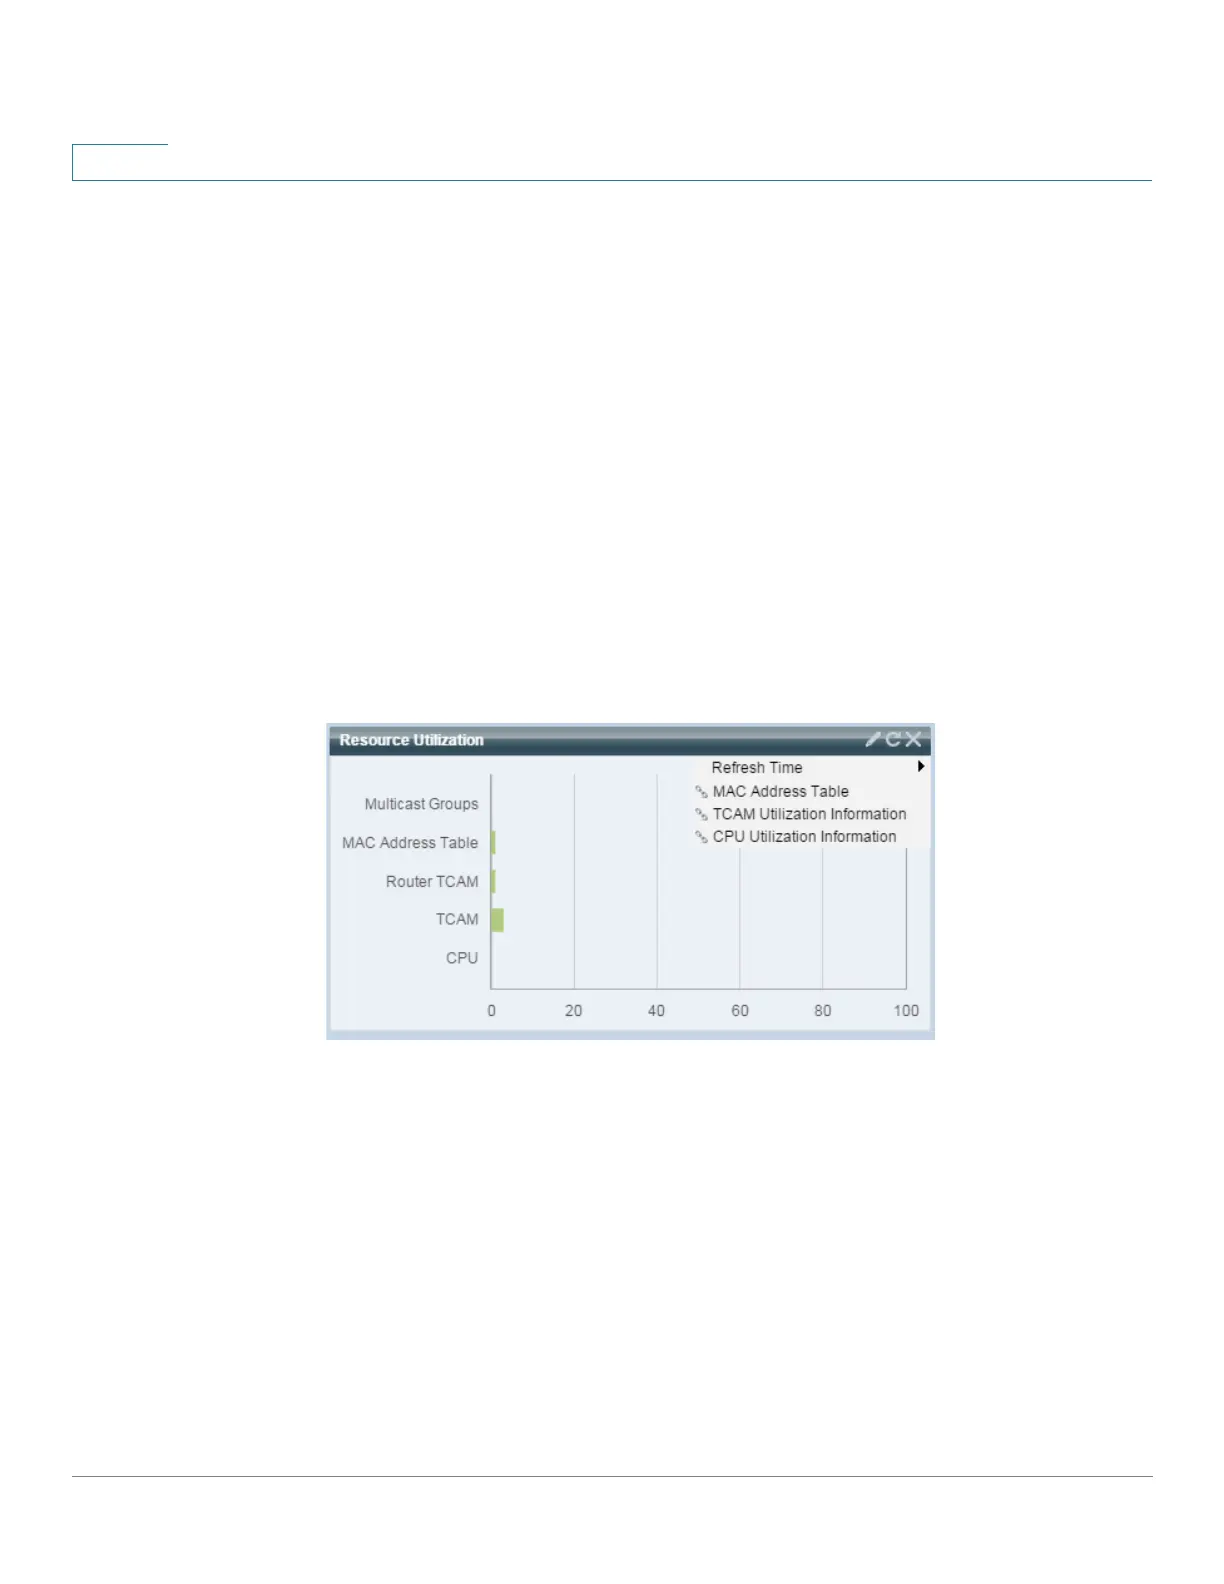
Resource Utilization
This module displays the utilization status in terms of a percentage of the various system
resources as a bar chart, as shown below:
The resources monitored are:
• Multicast Groups—Percentage of Multicast groups that exist out of the maximum
possible number that are permitted to be defined.
• MAC Address Table—Percentage of MAC Address table in use.
• Router TCAM—Usage in percentage of router TCAM.
• TCAM—Usage in percentage of all non-IP TCAM entries.
• CPU—Percentage of CPU being used.
Each bar becomes red if the resource utilization is higher than 80 percent.
 Loading...