Home Page6
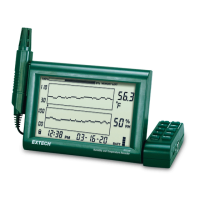
6.2 Home Page Summary Display
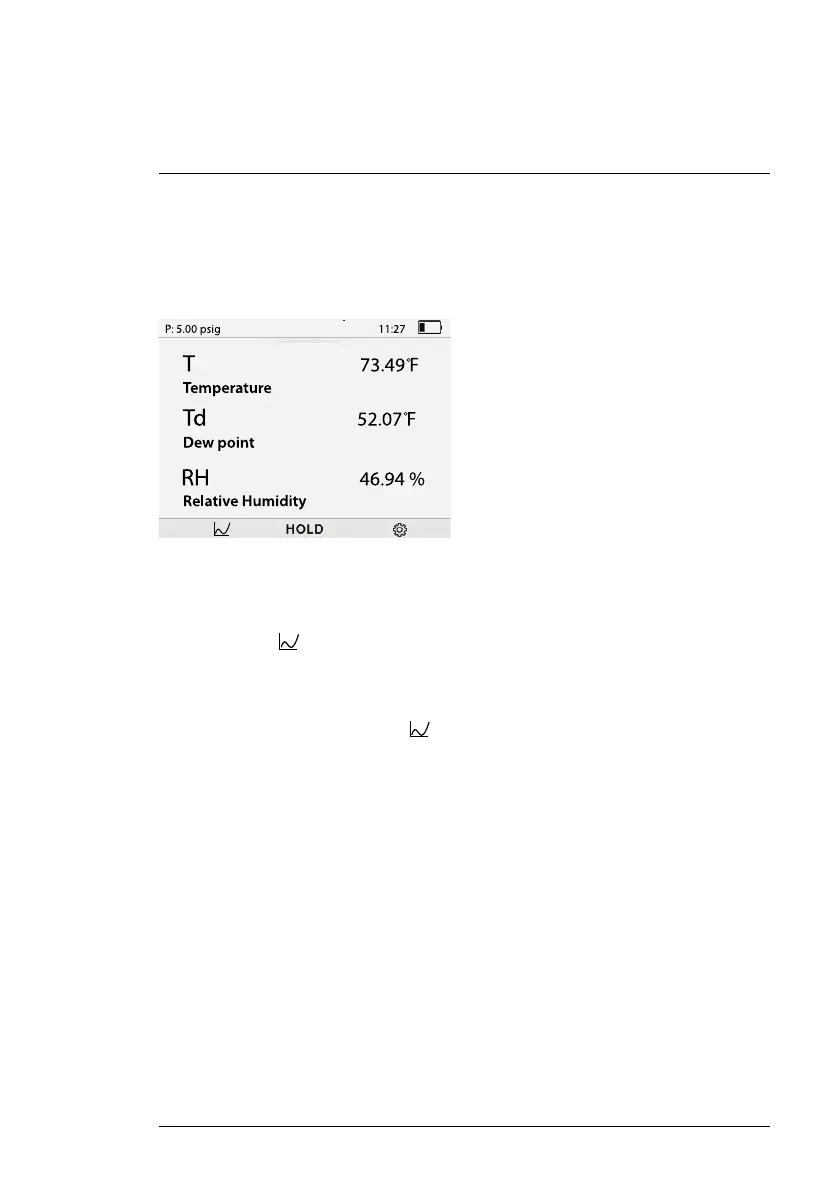
If you press the left or right arrow button at the Home page, the readings are
presented in a summary format as shown in Figure 6.2. Press the left or right
arrow button to return to the Home page.
Figure 6.2 Press the right or left arrow button from the Home page to view the readings in
summary format.
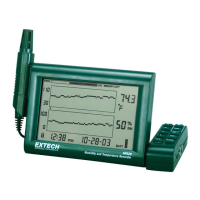
6.3 Real-Time Readings Plotted on Graphs
If you press F1
at the Home page, you can view readings plotted in real-
time on a set of four graphs. As shown in Figure 6.3, below, the first graph
(upper left) shows all three readings plotted on one graph. The remaining
three graphs show one reading per graph. Note that once you’ve accessed
the graph mode, the graph icon
is located above F3. Press F3 to step
through all graphs.
Press F2 to set the rate at which readings are plotted on the graphs. You can
select 1 second (1S), 5 seconds (5S), 30 seconds (30S), 1 minute (1min), 5
minutes (5min), or 10 minutes (10min). Press F1 to return to the Home page.
#NAS100113; r. AA/87024/87024; en-US
10
 Loading...