33
Plotter
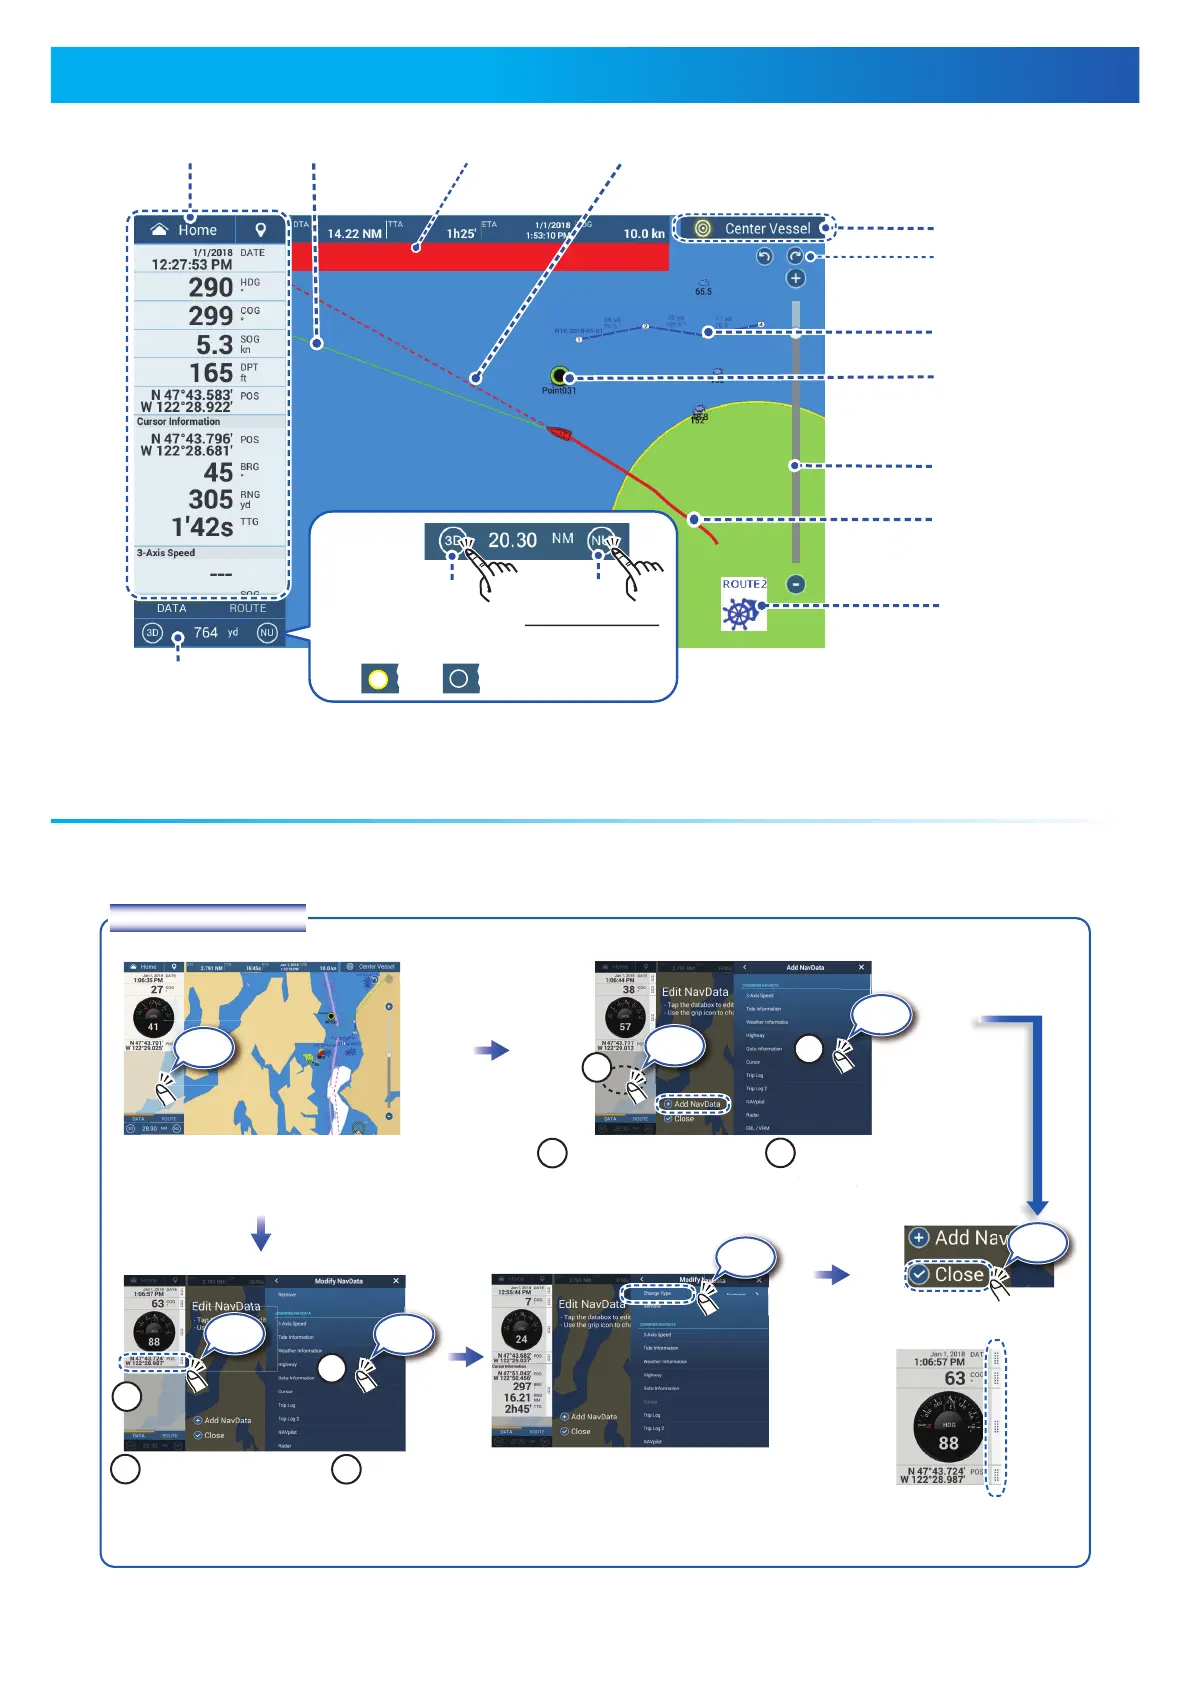
Swipe from the left edge of the screen rightward to show the data area at the left edge of the screen.
To hide the data area, swipe oppsite direction.
Data Area (Data Box)Data Area (Data Box)
Data area
COG vector (broken line)COG vector (broken line)
Heading line
(yellowish-green solid line)
To add a data box;To add a data box;
Data box settings
Alarm MessageAlarm Message
Display range
Track
Return own ship
to screen center.
Orientation Mode
Switch between
NU and HU.
Switch between 2D
and 3D. (Drag upward
with two fingers also.)
2D:
3D
3D:
3D
Boat iconBoat icon
Inactive route
(sleeping)
(Departure or
arrival point,
selectable on
[Layers] menu.)
Point
Inactive route
(expanded)
Position Lost
Left: Undo
Right: Back
Slide bar
Long tap the data box to show
[Edit NavData] display.
Long tap the data box to show
[Edit NavData] display.
11
11
Tap empty space on
the data box or
[+Add NavData].
Tap empty space on
the data box or
[+Add NavData].
2
2
Tap a data
to add.
Tap
Tap
Long
tap
Tap
Tap [Close] to finish.Tap [Close] to finish.
To delete a data box, or
change the displayed data;
To delete a data box, or
change the displayed data;
11
Tap
22
Tap
11
Tap the data box to
delete or change.
Tap the data box to
delete or change.
22
To delete the data box: Tap
the [Delete].
To change the data: Tap the
data to display.
To delete the data box: Tap
the [Delete].
To change the data: Tap the
data to display.
Tap
Tap [Change Type]
to change the data
display method
among Graphic
(analog), Numeric
(digital) and Graph.
Tap [Change Type]
to change the data
display method
among Graphic
(analog), Numeric
(digital) and Graph.
Grip icon: Drag the grip icon to
move the data box.
Grip icon: Drag the grip icon to
move the data box.
 Loading...