Performance and ceves diagrams
11.Performence and cerves diagrams
45
Domestic air conditioner
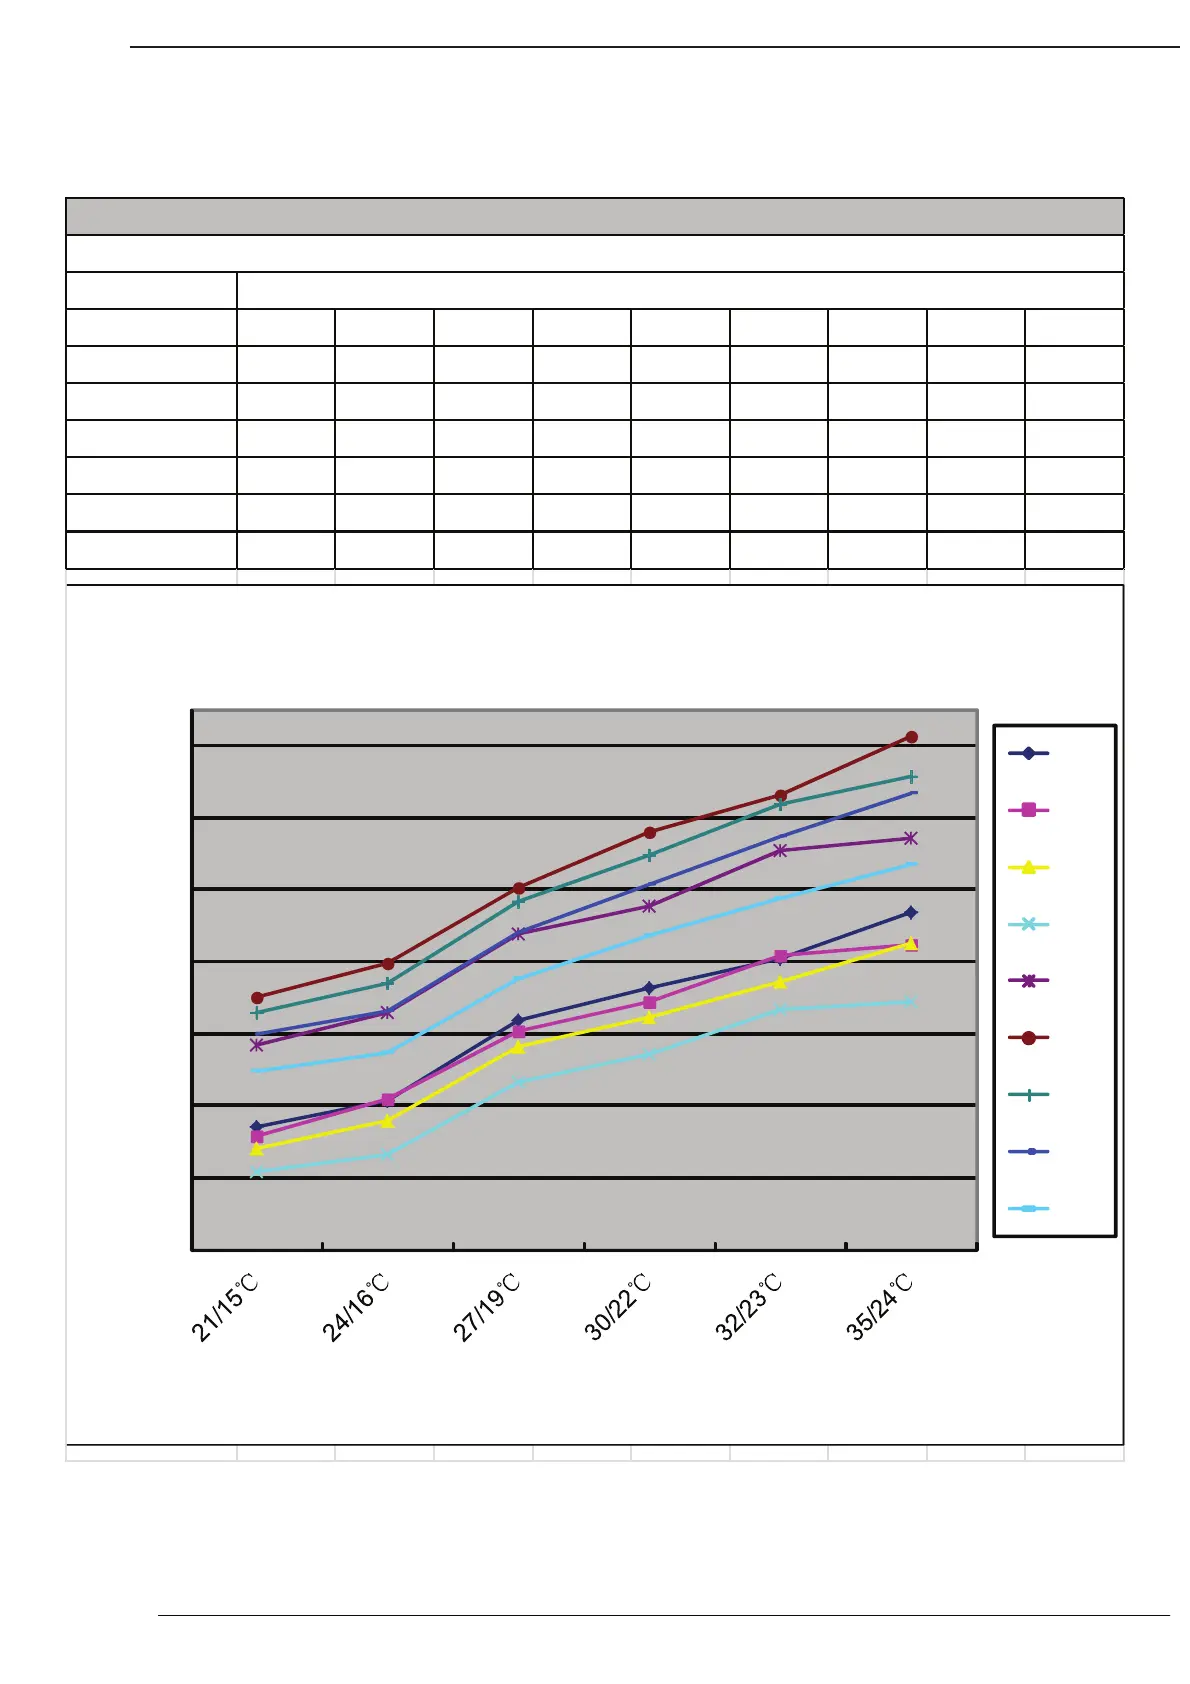
11.1 Cooling capacity-temperature curves
indoor temp.
DB/WB 10℃ 15℃ 20℃ 25℃ 30℃ 35℃ 38℃ 40℃ 43℃
21/15℃ 1539 1513 1479 1415 1767 1900 1857 1799 1697
24/16℃ 1612 1619 1557 1465 1857 1993 1938 1860 1748
27/19℃ 1837 1805 1764 1663 2077 2204 2166 2079 1950
30/22℃ 1927 1886 1845 1743 2153 2358 2296 2214 2071
32/23℃ 2009 2017 1945 1865 2309 2463 2438 2348 2174
35/24℃ 2135 2045 2053 1887 2343 2624 2515 2466 2271
cooling value-temerature table
performance curves
outdoor temp.
1200
1400
1600
1800
2000
2200
2400
2600
cooling capacity (W)
cooling capacity and indoor/outdoor temp.curves
10℃
15℃
20℃
25℃
30℃
35℃
38℃
40℃
43℃
indoor temp.(DB/WB)