Network Video Recorder User Manual
103
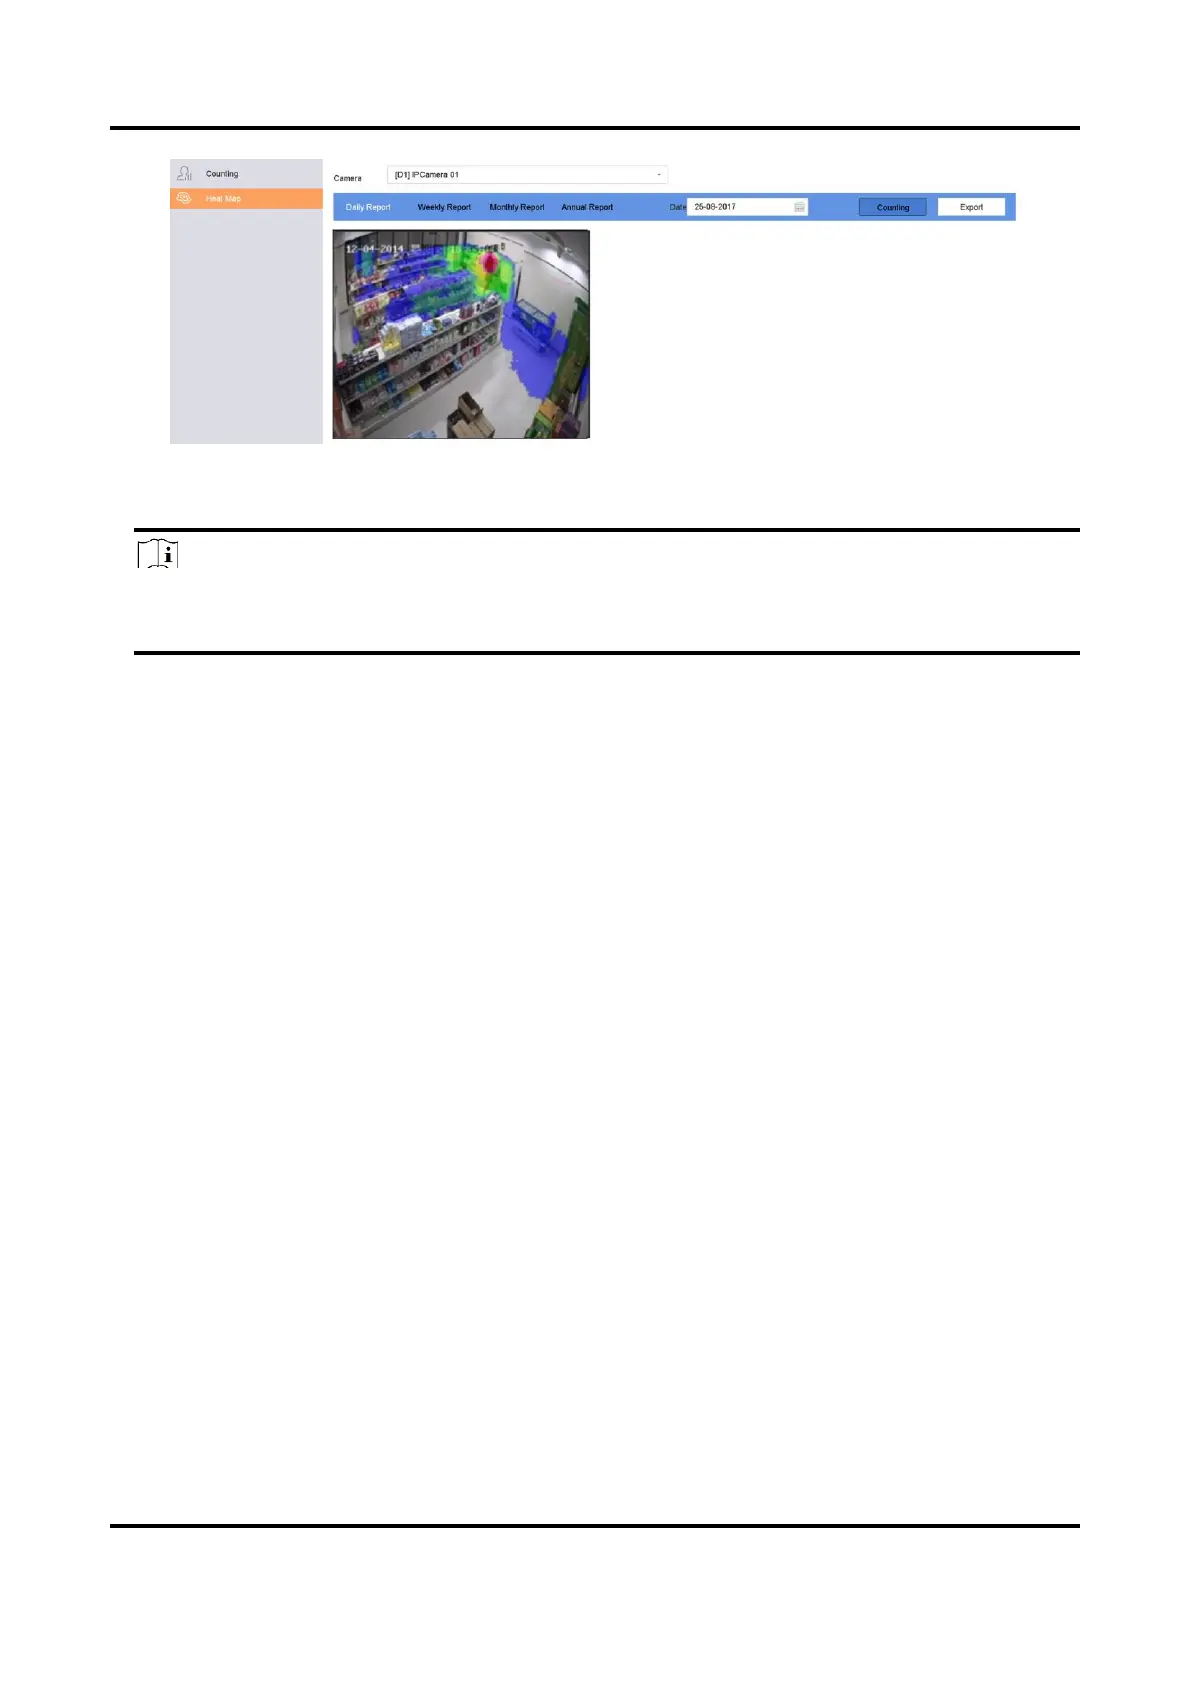
Figure 8-2 Heat Map
5. Click Counting.
Note
As shown in the figure above, red color block (255, 0, 0) indicates the most trafficked area, and
blue color block (0, 0, 255) indicates the less-popular area.
The results will be displayed in graphics marked in different colors.
6. Optional: Click Export to export the statistics report in Microsoft Excel format.
 Loading...