TROUBLESHOOTING METHOD
OF
USING TROUBLESHOOTING CHARTS
METHOD OF USING TROUBLESHOOTING CHARTS
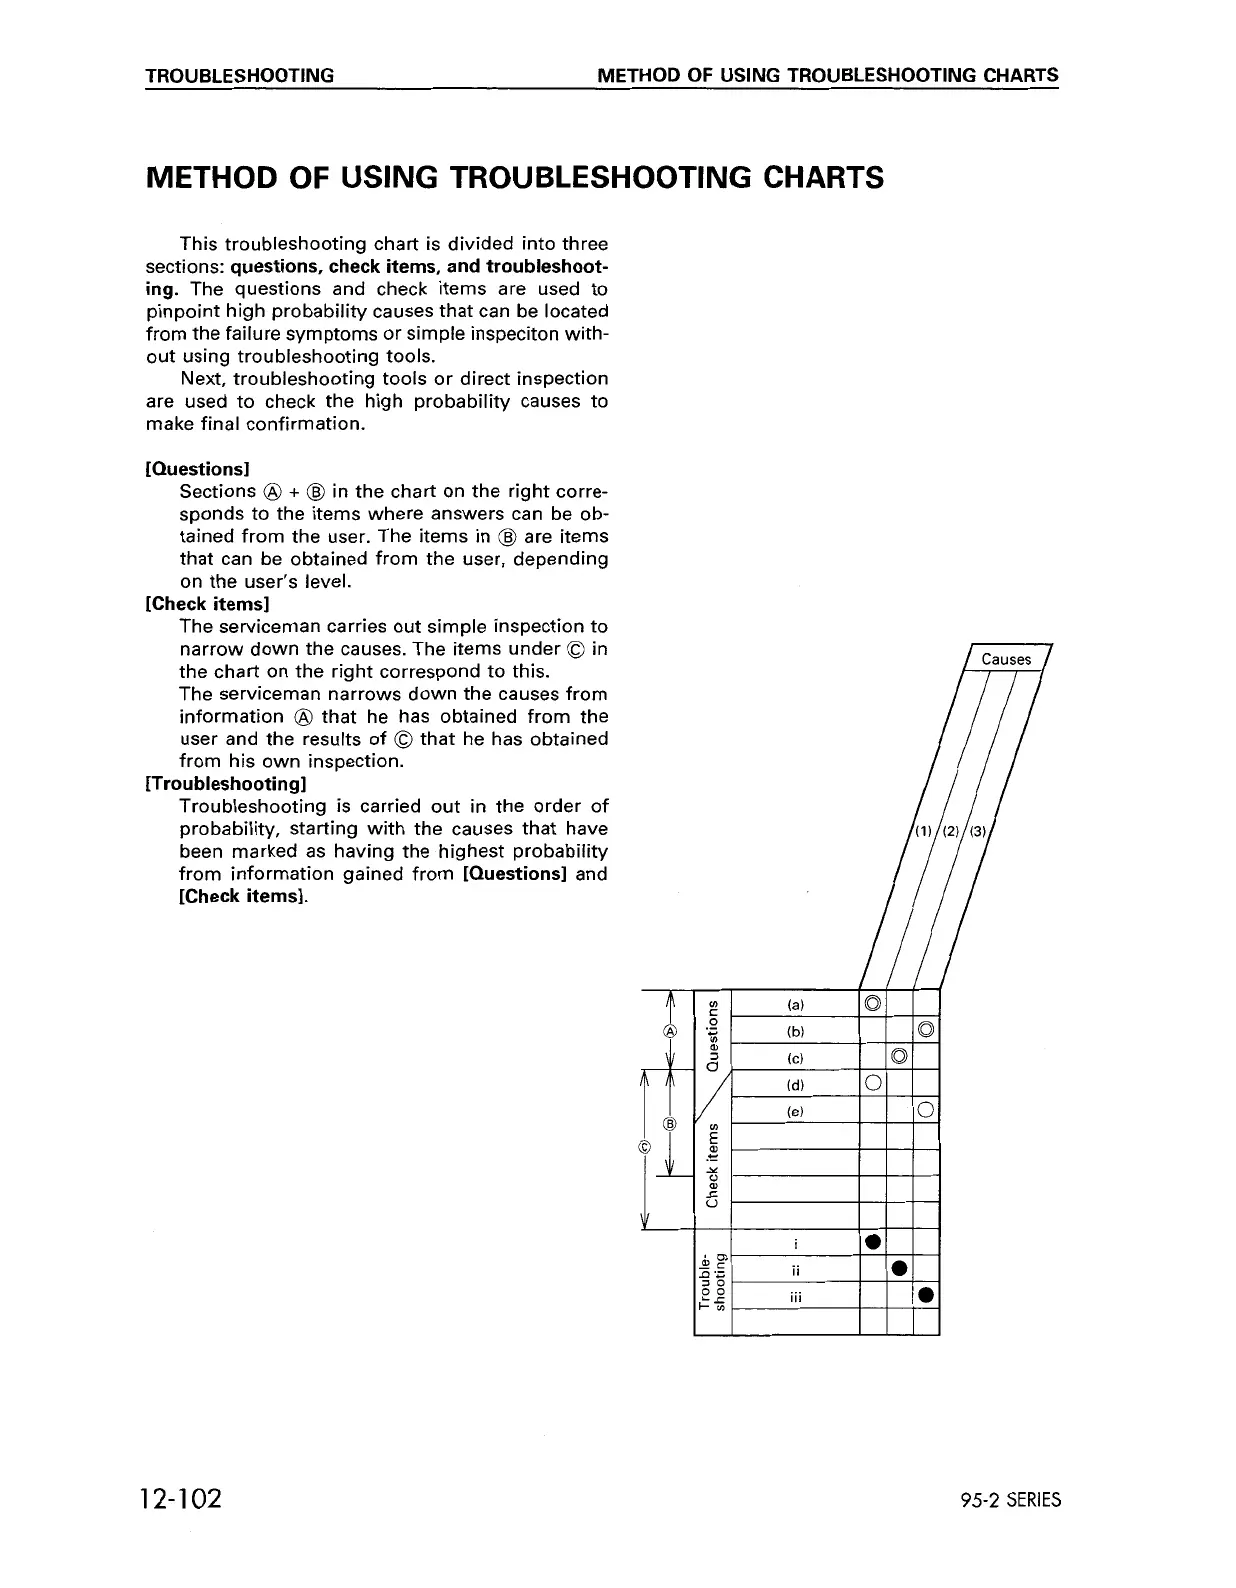
This troubleshooting chart is divided into three
sections:
questions, check items, and troubleshoot-
ing.
The questions and check items are used to
pinpoint high probability causes that can be located
from the failure symptoms or simple inspeciton with-
out using troubleshooting tools.
Next, troubleshooting tools or direct inspection
are used to check the high probability causes to
make final confirmation.
[Questions]
Sections
@
+
@
in the chart on the right corre-
sponds to the items where answers can be ob-
tained from the user. The items in
@
are items
that can be obtained from the user, depending
on the user’s level.
The serviceman carries out simple inspection to
narrow down the causes. The items under
@
in
the chart on the right correspond to this.
The serviceman narrows down the causes from
information
@
that he has obtained from the
user and the results
of
0
that he has obtained
from his own inspection.
Troubleshooting is carried out in the order
of
probability, starting with the causes that have
been marked as having the highest probability
from information gained from
[Questions]
and
[Check items].
[Check items]
[Troubleshooting]
12-1
02
95-2
SERIES
 Loading...