Effectivity: 914 Series BRP-Powertrain page 7-10
OM Edition 2 / Rev. 0 April 01/2009
d04479.fm
Nominal boost
pressure
See Fig. 6
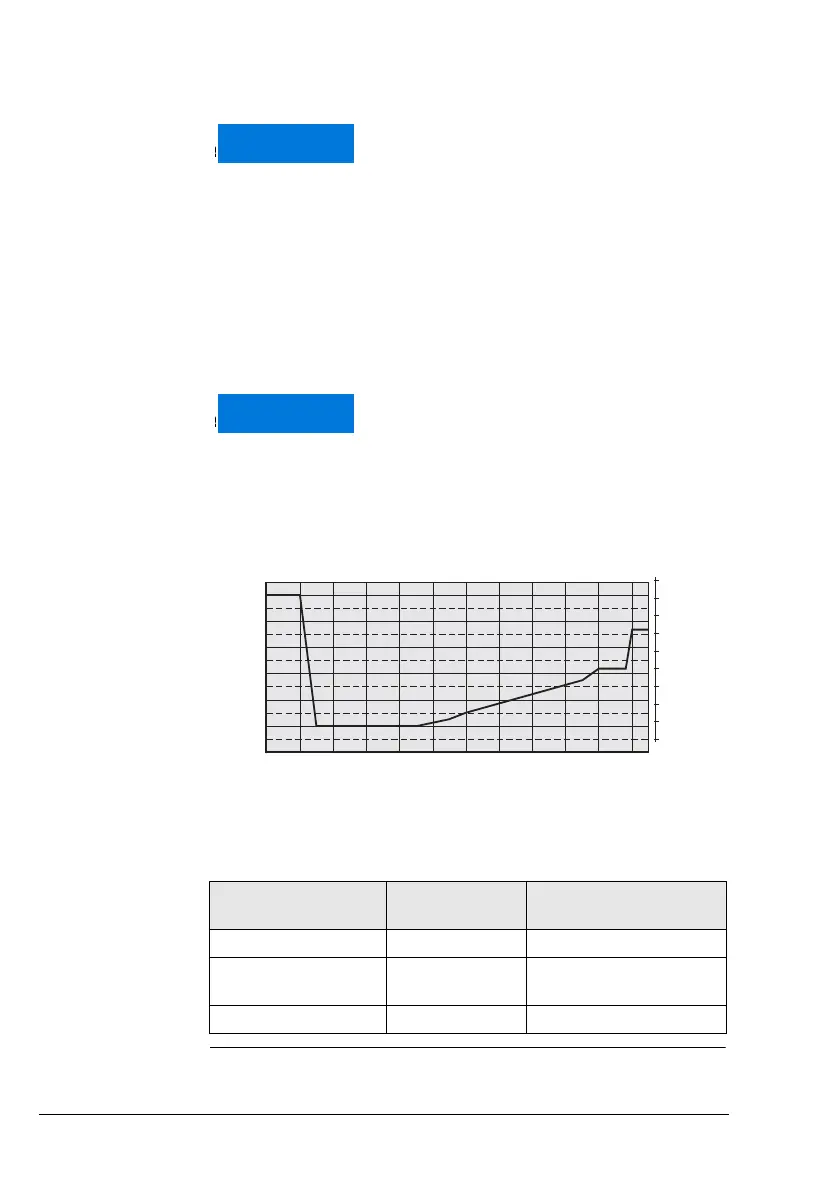
For correlation between throttle position and nominal boost pres-
sure in the airbox, refer to the diagram.
In this range (108 to 110 % throttle position) small changes in
throttle position have a big effect on engine performance and
speed, but are virtually not apparent for the pilot from the throttle
lever position.
Throttle position
versus nominal
airbox pressure
NOTE: In the course of model refinement some param-
eters have been slightly changed. Diagram and
table shown the current state of software.
Fig. 6
00170
The most important points for engine operation:
As shown in the diagram, the throttle position
at 108 to 110 % results in a rapid rise of nom-
inal boost pressure. To avoid unstable boost,
the throttle should be moved smoothly
through this area either to full power (115 %)
or, on a power reduction, to max. continuous
power (100 %).
The exact setting for a specific performance
is virtually impossible in this range and has to
be prevented, as it might cause control fluctu-
ations (surging).
28
1400
1300
1200
1100
1000
900
hPa
0 10 20 30 40 50 60 7 0 80 90 100 110 115 %
30
32
34
36
38
46 in. HG
1500
40
42
44
engine performance throttle position
nominal manifold pres-
sure
idling of engine ~ 0 % 1500 hPa (44.3 in.HG)
max. continuous per-
formance
100-108 % 1220 hPa (36.0 in.HG)
take-off performance 110-115 % 1370 hPa (40.5 in.HG)
 Loading...