EasyManuals Logo
Home>TCL>Air Conditioner>TAC-12CHSC

TCL TAC-12CHSC User Manual

TCL TAC-12CHSC
138 pages
To Next Page IconTo Next Page
To Previous Page IconTo Previous Page
Page #71 background imageLoading...
Page #71 background image
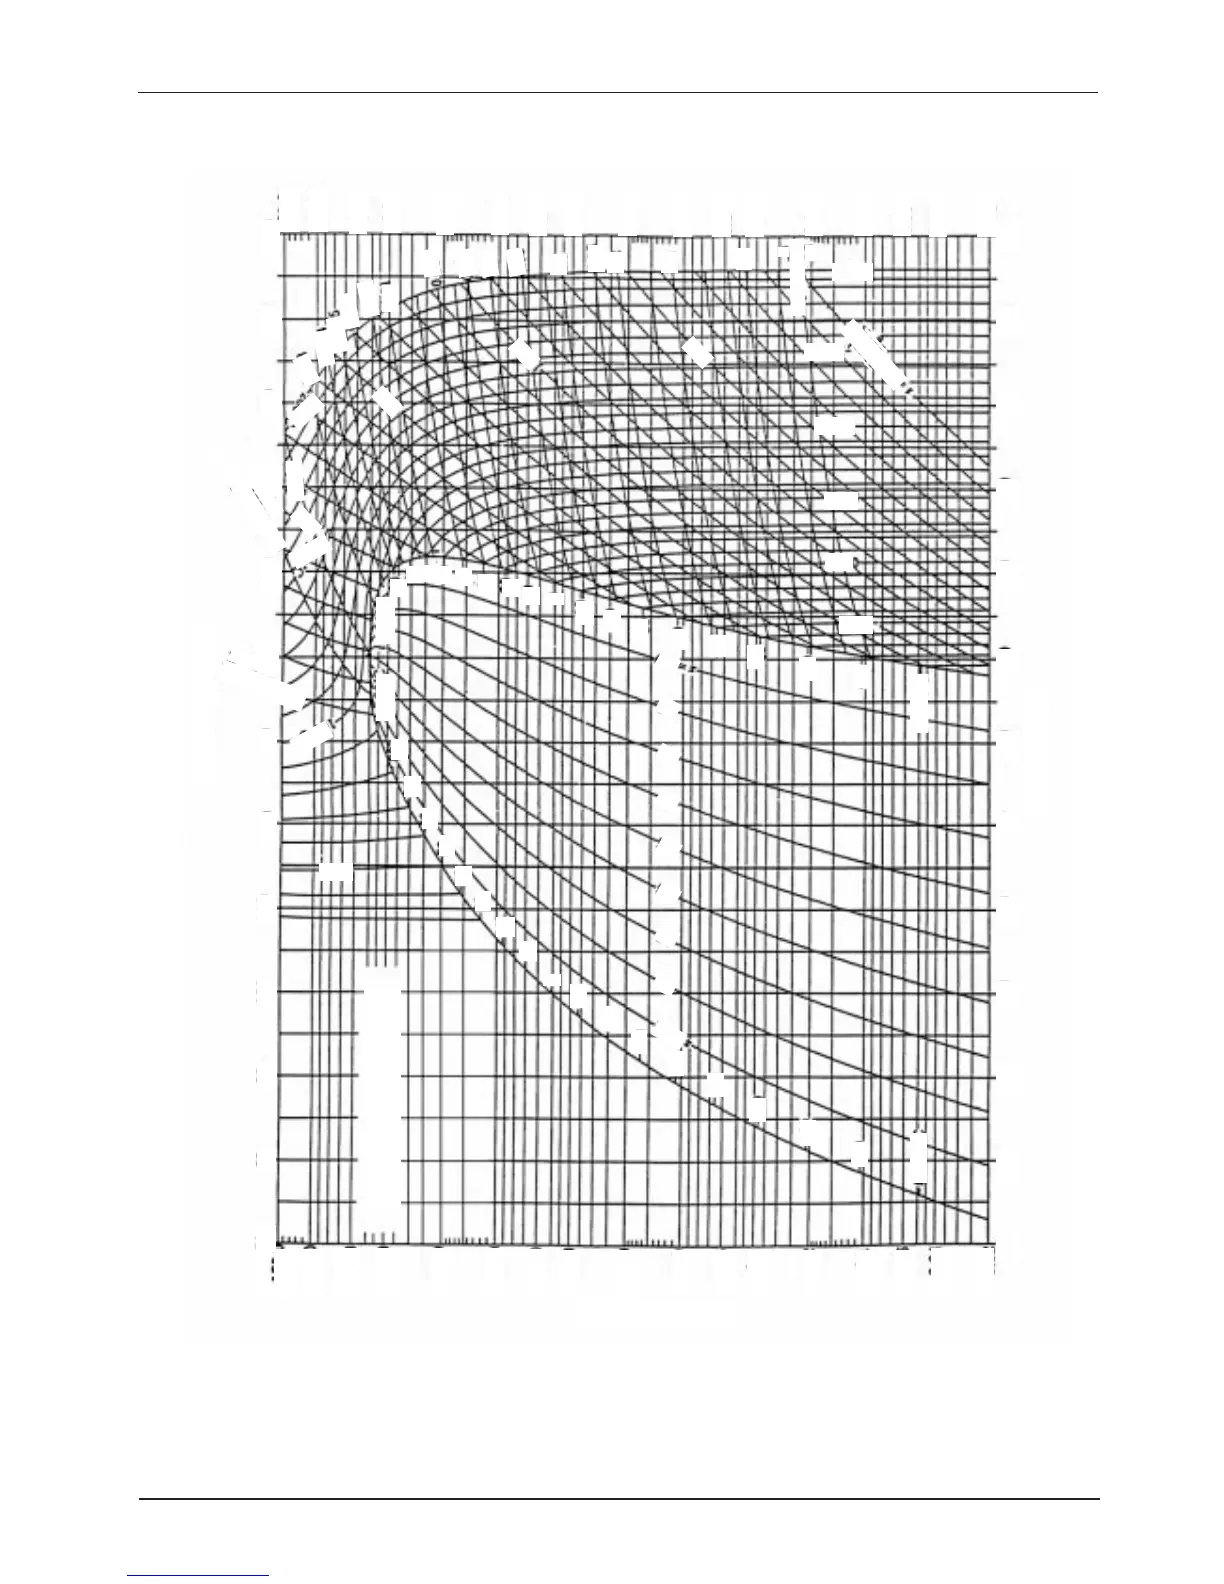
Mollier diagram
p-h graph of R22
p-h graph of R22
S=1.35kcal/kg.K
v= 0.0015m
3
/kg
P (kgf/cm
2
)
150.0
150.0
70
80
90
100
110 120
130
140
150
160
170
180
190
60.0
40.0
20.0
10.0
6.0
4.0
2.0
1.0
0.6
0.4
0.2
0.1
0.06
0.04
0.02
t=-90°C
t=-90°C
-80
-70
-60
-50
-40
x=0.1
0.2
0.3
0.4
0.5
0.6
0.7
0.8
0.9
-30
-20
-10
0
10
20
30
40
50
60
70
80
t=90°C
t=90°C
50°C
50°C
50°C
100°C
150°C
200°C
0.002
100°C
150°C
200°C
1.30
1.25
1.20
0.003
0.004
0.005
0.006
0.008
0.01
0.06
0.1
0.15
0.2
0.4
1.0
0.02
0.03
0.04
1.15
0°C
80
-80
70
60
-60
-70
50
-50
40
-40
30
-30
20
-20
10
-10
0
100.0
60.0
40.0
20.0
10.0
6.0
4.0
2.0
1.0
0.6
0.4
0.2
0.1
0.06
0.04
0.02
70
80
90
100
110
120
130
h kcal/kg
140
150
160
170
180
190
s=1.10kcal/kg.K
150.0
v= 2.0m
3
/kg
15

Table of Contents

Questions and Answers:

Question and Answer IconNeed help?

Do you have a question about the TCL TAC-12CHSC and is the answer not in the manual?

TCL TAC-12CHSC Specifications

General IconGeneral
BrandTCL
ModelTAC-12CHSC
CategoryAir Conditioner
LanguageEnglish

Related product manuals