UT3200 Series User Manual
19
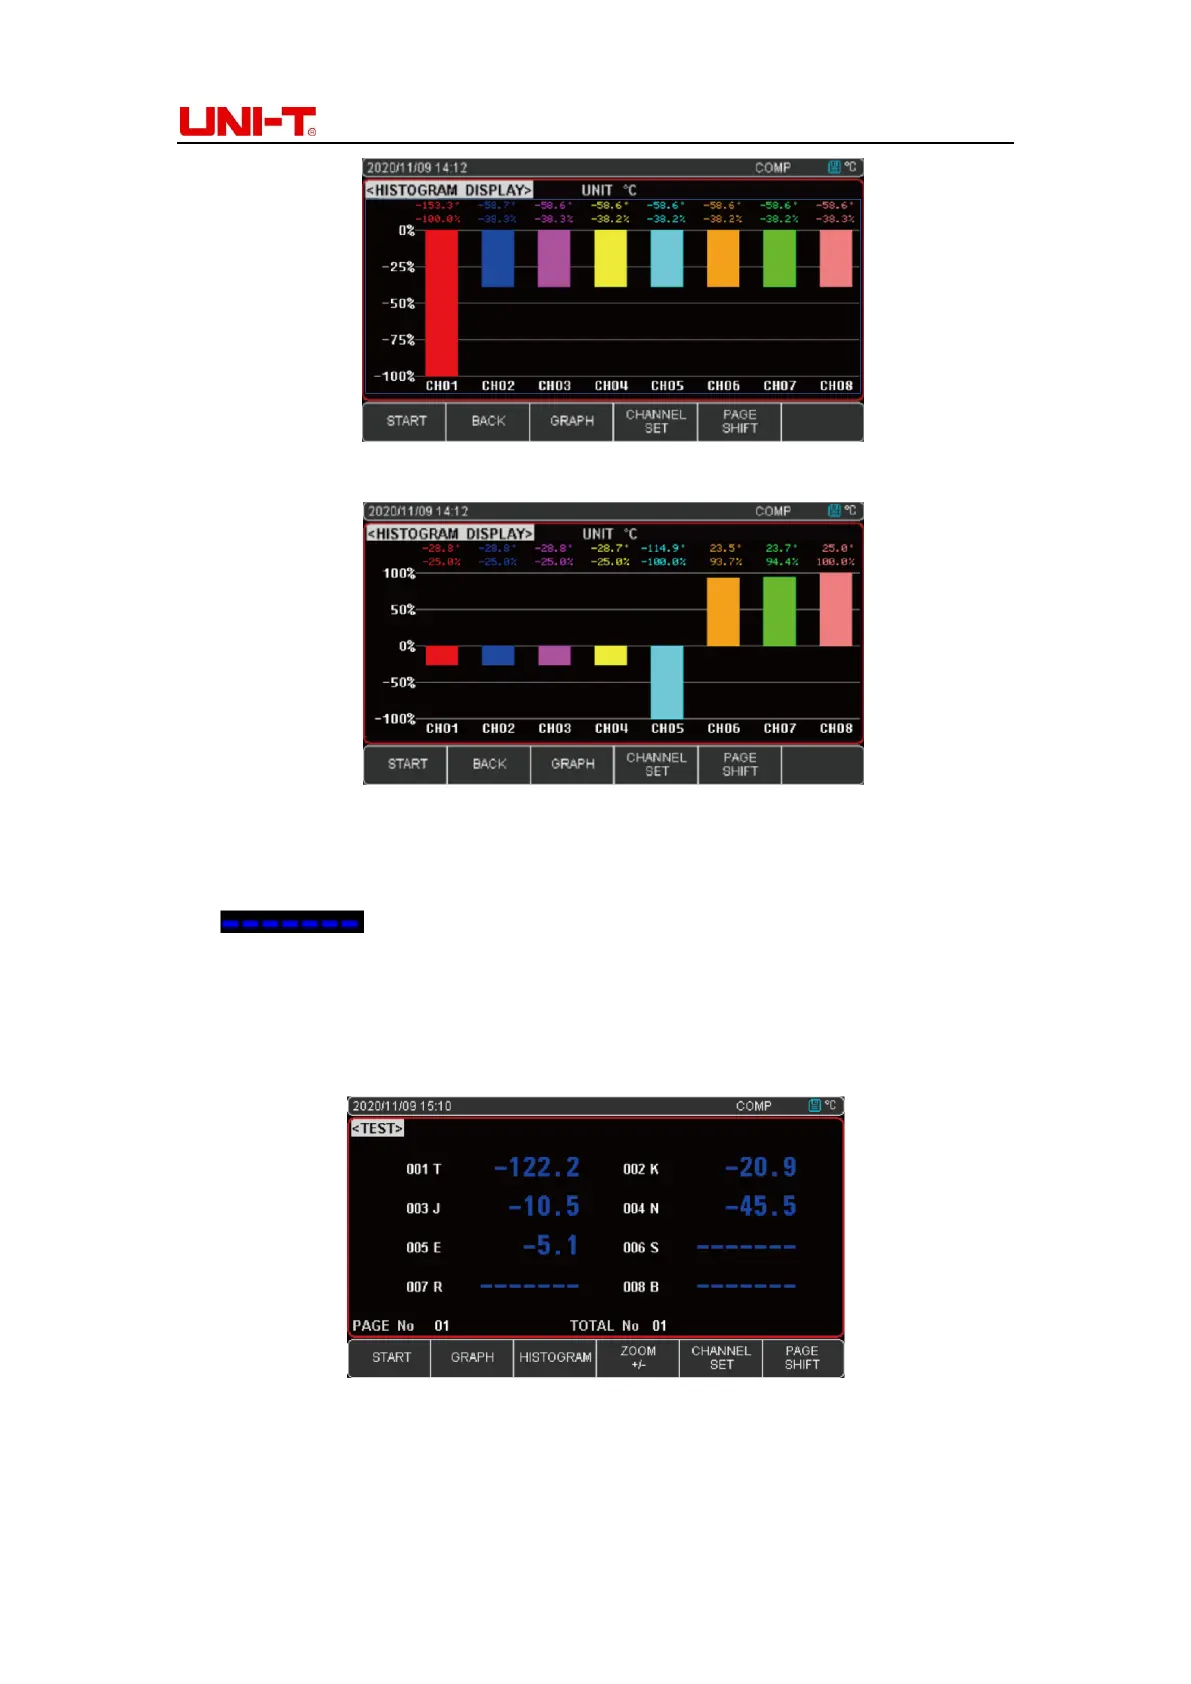
Figure 4-3-1B CH01-08 Histogram figure (Temperature value<0)
Figure 4-3-1C CH01-08 Histogram figure (Positive and negative temperature)
When the current temperature value over the high limit of the range, it will display
. At this time, the system will judge the channel value as positive value
to divide the column into upward and downward display in this situation. The
temperature reading is not displayed in the bar chart and the percentage is invalid as
0.0%. Refer to Figure4-3-1D
Figure 4-3-1D Out of test range histogram figure value
 Loading...