107
Using the meter as an electronic notebook
5
5.3 Average, highest value and lowest value for 7, 14 and 30
days
The meter can display the average values of results from the last 7, 14
or 30 days. Also, you can request that the lowest and highest values be
displayed for these 3 periods. All results falling within the relevant
period are included in the calculation. The current day is always
included in the calculation. If more than 500 test results were saved
during this period, the calculation will be based on the last 500 test
results.
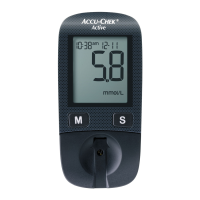
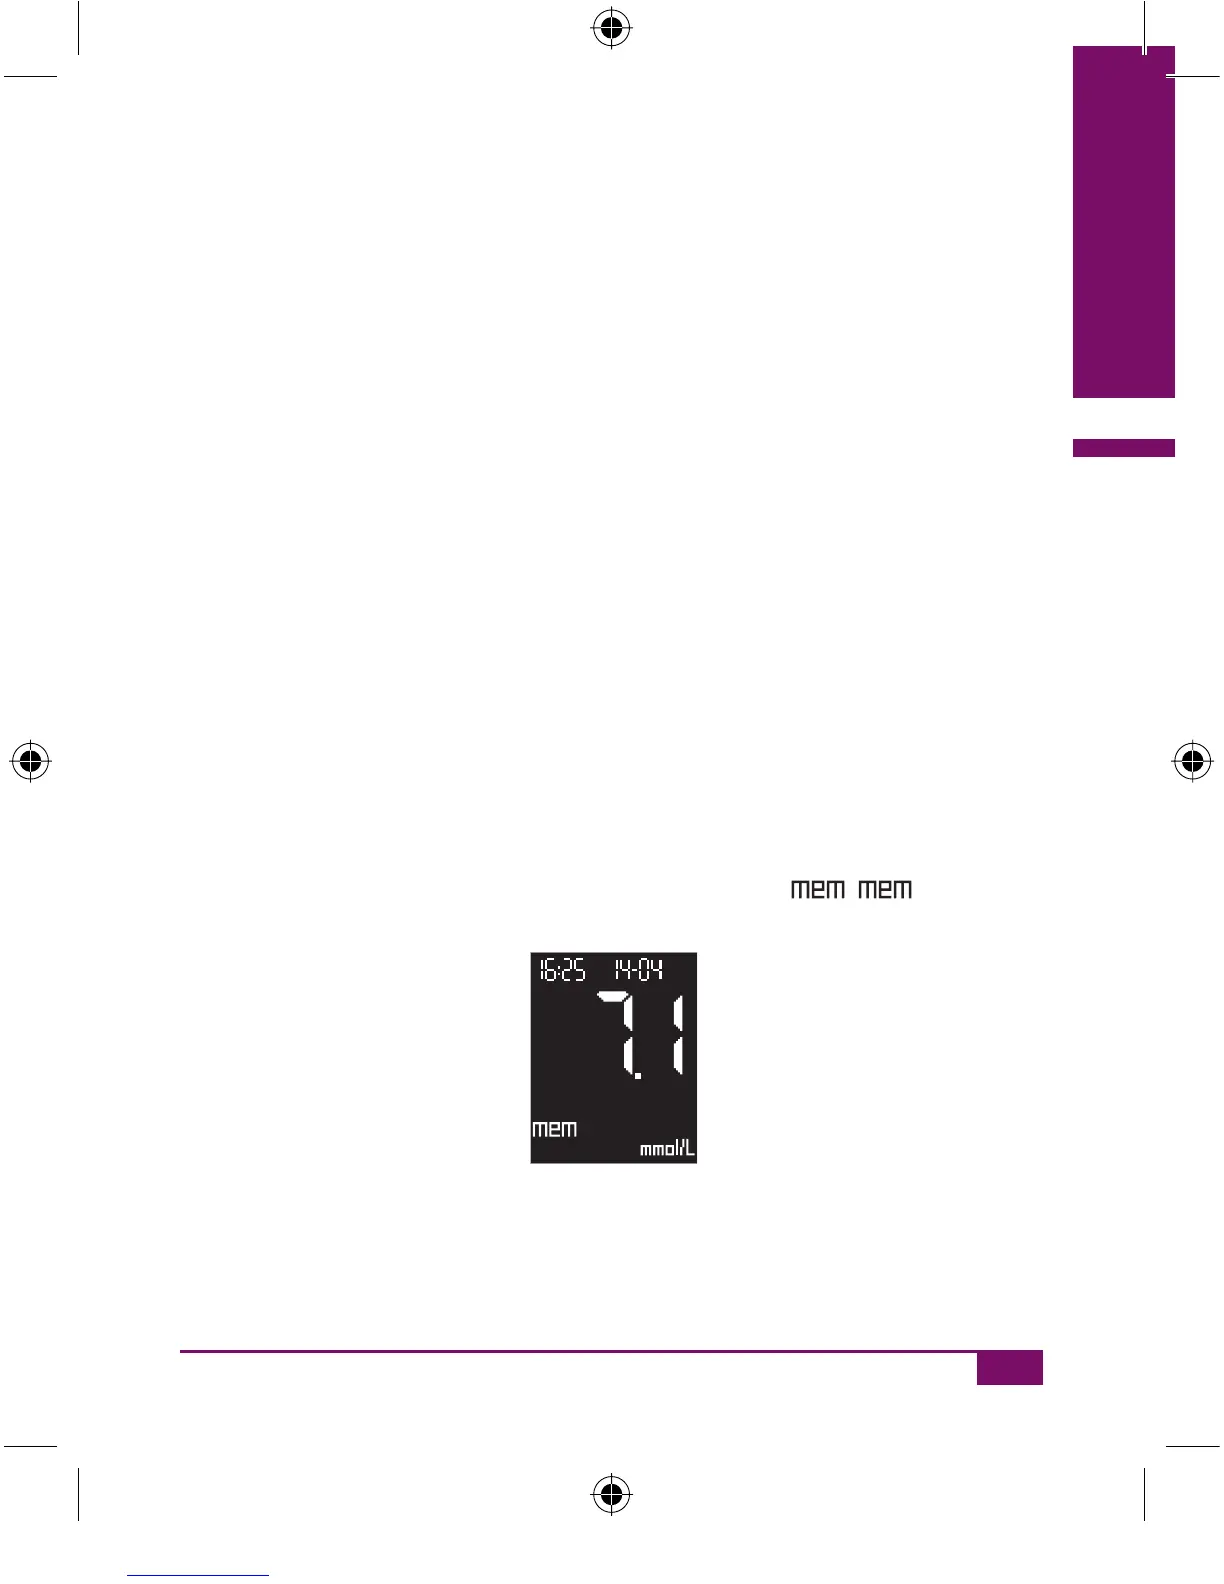
With the meter turned off, press the M button.
The meter turns on without advancing a test strip.
Following the display check (see Chapter 2.2.2), the most recently saved
result is displayed together with the time, date and
. is short
for memory.
AC_CP_LCM_Manual_EN-UK final.indd 107_CP_LCM_Manual_EN-UK final.indd 107 20.6.2007 11:04:2320.6.2007 11:04:23
 Loading...