5-49
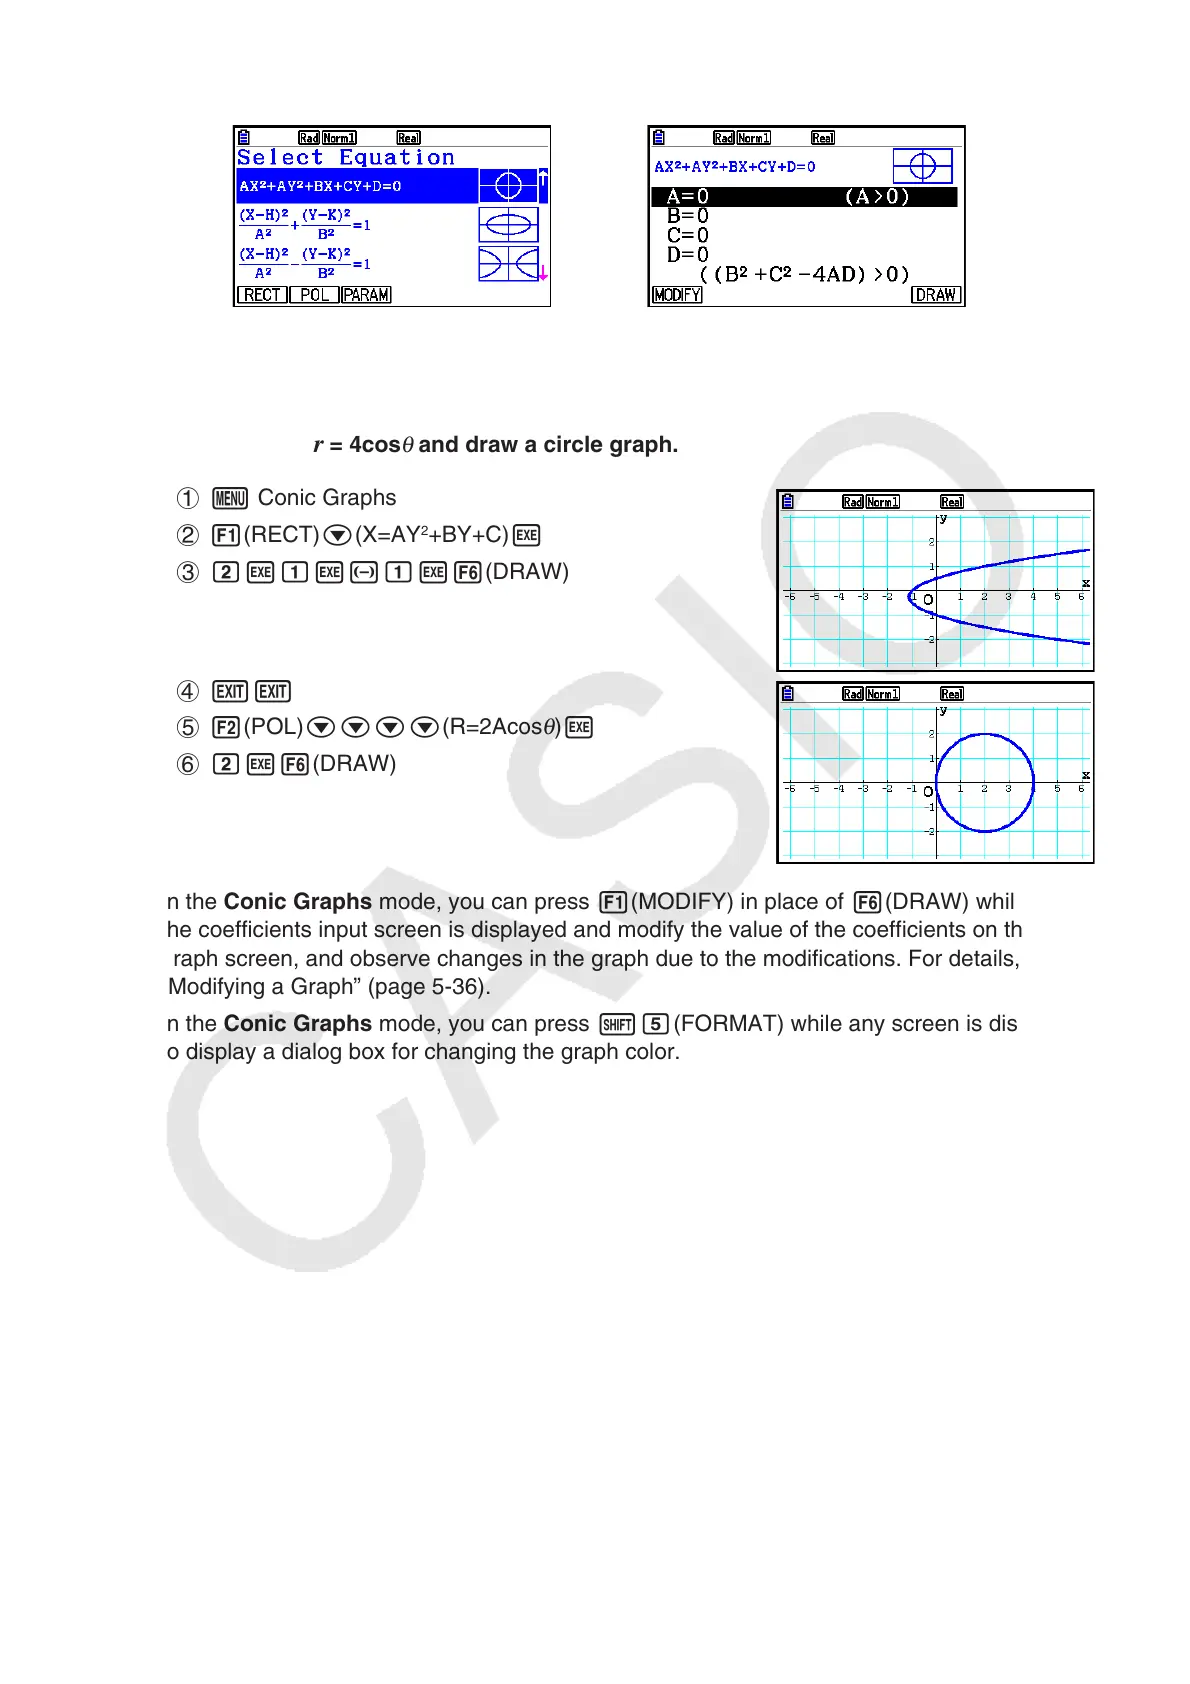
3. Select the pattern of the function in accordance with the type of graph you want to draw.
R
w
4. Enter the coefficients of the function and draw the graph.
Example To input the rectangular coordinate function
x = 2 y
2
+ y − 1 and graph a
parabola open on the right, and then input the polar coordinate function
r = 4cos
θ
and draw a circle graph.
1 m Conic Graphs
2 1(RECT) c(X=AY
2
+BY+C) w
3 cwbw-bw6(DRAW)
4 JJ
5 2(POL) cccc(R=2Acos
θ
) w
6 cw6(DRAW)
• In the Conic Graphs mode, you can press 1(MODIFY) in place of 6(DRAW) while
the coefficients input screen is displayed and modify the value of the coefficients on the
graph screen, and observe changes in the graph due to the modifications. For details, see
“Modifying a Graph” (page 5-36).
• In the Conic Graphs mode, you can press !f(FORMAT) while any screen is displayed
to display a dialog box for changing the graph color.