EasyManua.ls Logo

D-Link DXS-3600-32S User Manual

D-Link DXS-3600-32S
45 pages
To Next Page IconTo Next Page
To Previous Page IconTo Previous Page
Page #12 background imageLoading...
Page #12 background image
DXS-3600-32S 10GbE Layer 2/3 Switch Web UI Reference Guide
7
Temperature Status
In the Temperature section, the user can view a real-time display of the switch’s internal temperature. The temperature
of the switch is mainly influenced by two factors: (1) the enviroment, and (2) the internal air-flow of the switch. In the
Hardware Installation Guide, there are some guidelines the can assist the user with the installation of this switch in a
temperature friendly environment. The fan modules, installed in this switch, have temperature sensors built-in, that
automatically controls the air-flow inside the switch.
In the Temperature section, the following display parameters are available:
Parameter Description
Percentage Display In this graphic, the reading is divided into percentage sections. The green area is
known as the ‘safe’ area. This area ranges from 0% to 60%. This is the optimum
temperature range recommended for this switch.
Temperature Below the percentage gauge needle, the accurate temperature reading, for this
switch, is displayed in degrees celsius.
Warning Section In this graphic, the reading is divided into percentage sections. The red area is
known as the ‘warning’ area. This area ranges from 60% to 100%. It is
recommended not to allow the switch to run this hot, to avoid component damage.

Other manuals for D-Link DXS-3600-32S

Question and Answer IconNeed help?

Do you have a question about the D-Link DXS-3600-32S and is the answer not in the manual?

D-Link DXS-3600-32S Specifications

General IconGeneral
BrandD-Link
ModelDXS-3600-32S
CategorySwitch
LanguageEnglish

Summary

Intended Readers

Typographical Conventions

Notes, Notices, and Cautions

Safety Instructions

Safety Cautions

General Precautions for Rack-Mountable Products

Protecting Against Electrostatic Discharge

Web-based Switch Configuration

Management Options

Details available access platforms for switch management (CLI, SNMP, Web).

Connecting using the Web User Interface

Guide on accessing the switch via a web browser and HTTP protocol.

Logging onto the Web Manager

Steps to access the Web UI by entering the switch's IP address.

Areas of the User Interface

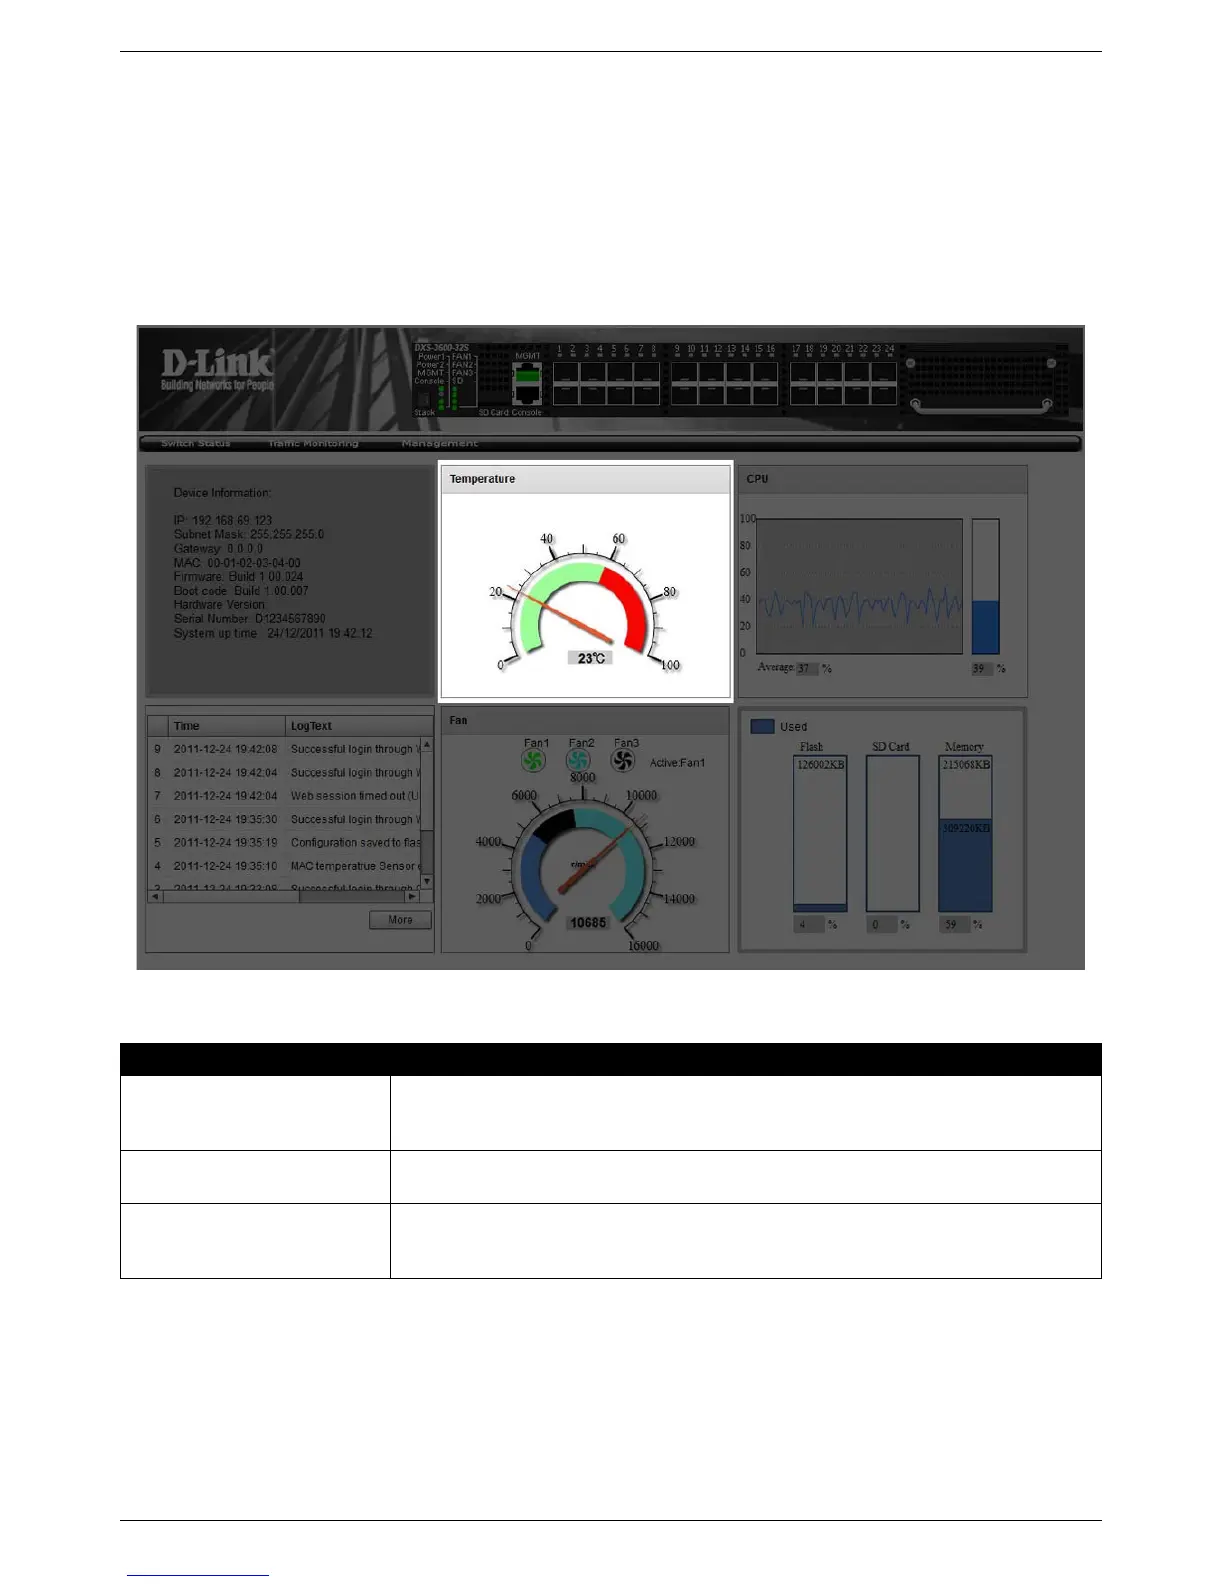
Overview of the main display areas within the Web UI.

Switch Status

Device Information

Displays basic switch details like IP, MAC, firmware, and uptime.

Temperature Status

Real-time display of the switch's internal temperature and warning levels.

CPU Status

Real-time display of the switch's CPU usage percentage.

System Log Entries

View system log entries generated by the switch for event tracking.

Fan Status

Real-time display of the switch's fan status and RPM.

Flash, SD Card, and Memory Status

Displays memory usage for Flash, SD Card, and RAM.

Traffic Monitoring

Traffic Monitoring by Direction

Monitor per-port traffic in received (Rx) or transmitted (Tx) directions.

Traffic Monitoring by Type

Monitor per-port traffic by type, such as Unicast, Multicast, Broadcast.

Traffic Monitoring by Size

Monitor per-port traffic based on packet size ranges.

Traffic Monitoring by Error

Monitor per-port traffic for specific error types and directions.

Management

Download Firmware

Procedure for downloading firmware files to the switch.

Download Configuration

Procedure for downloading the current switch configuration.

Upload Firmware

Procedure for uploading new firmware files to the switch.

Upload Configuration

Procedure for uploading a saved configuration file to the switch.

Appendix A - Password Recovery Procedure

Appendix B - System Log Entries

Appendix C - Trap Entries

Related product manuals