EXAMPLE:
Choosing 10 parameters sampling every 10 minutes will
provide over 4,460 samples or over 30 days before data
begins to be overwritten. While choosing 40 parameters
sampling every 5 minutes, the Data Profiler will only provide
over 1550 samples or over 5 days before data begins to be
overwritten.
Another consideration when configuring the profiler is that
sampling unneeded parameters or unnecessarily often may
lessen the life of the non-volatile memory in the control. The
non-volatile memory life when sampling 10 parameters
every 10 minutes, under normal conditions, the would be
more than100 years.
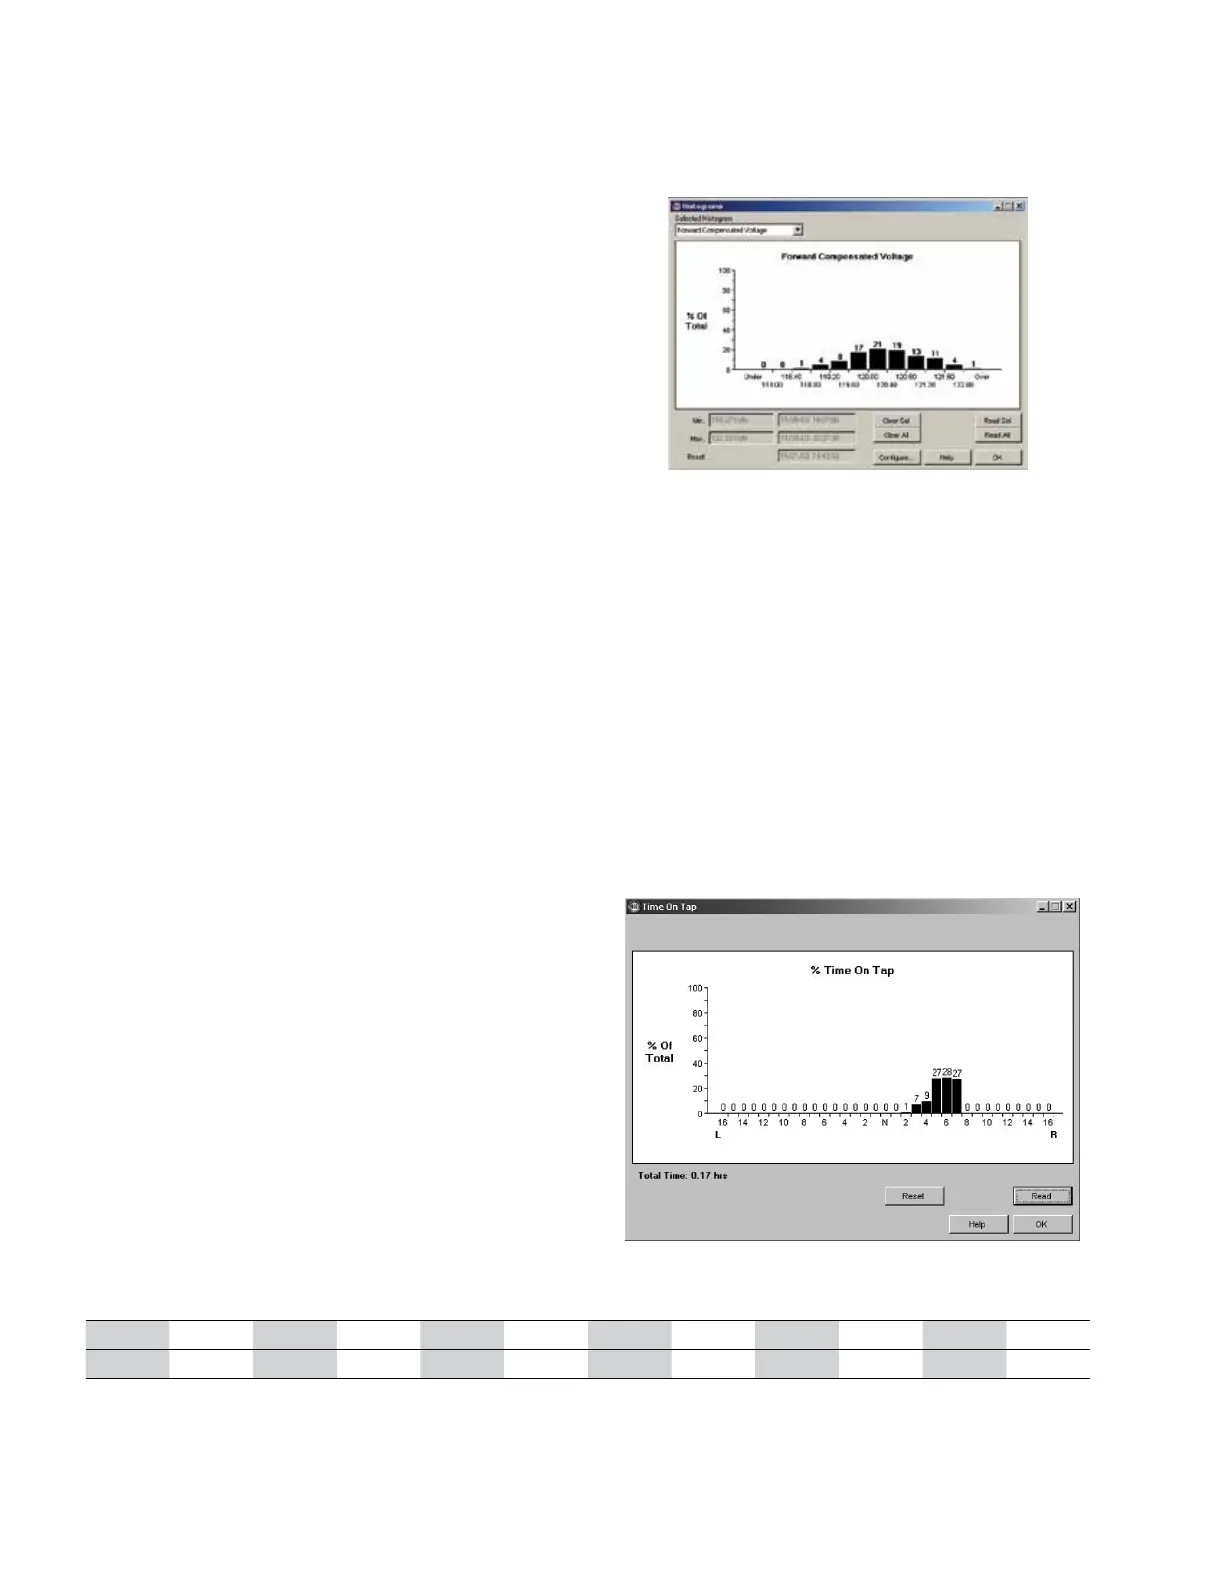
Histograms
Histograms offer the user a quick visual method to
understand the operation of the voltage regulator. The
histogram data and configuration can only be accessed via
communications. The histogram data is intended to be
viewed in bar graph form. Data is available for Percent
Regulation and the following Forward and Reverse demand
parameters:
•
Primary Load Current
•
Secondary Load Voltage
•
Secondary Source Voltage
•
Secondary Compensated Voltage
•
Load kVA
•
Load kW
•
Load kvar
The histogram is also configured via communications. The
user sets a low and high limit for each parameter, creating a
range of acceptable values. The control divides this range
into 10 equal bins plus one Over and one Under bin for a
total of twelve bins; see Figure 7-8.
EXAMPLE:
The user chooses a low limit of 118 V and a high limit of 122
V for the Compensated Voltage parameter. The control
creates bins as shown in Figure 7-8.
The control then samples each of these parameters once
per minute and increments the appropriate bin. The
maximum and minimum value of the sampled parameter is
also stored with the histogram data (note that these values
may not be the same as the high and low value in the
demand metering section due to the sampling used).
After a period of time has passed, the histogram for this
example displays, using ProView NXG software to view, as
shown in Figure 7-9. The sample Histogram suggests that
the compensated voltage is varying greatly. The source of
this variation should be investigated. Possible causes
include an unstable system supply voltage, improper control
settings, or a greatly varying load.
TIME-ON-TAP feature
The TIME-ON-TAP™ feature logs the amount of time spent
on each tap-changer position. The TIME-ON-TAP data is
accessed via the ProView NXG software and is viewed in
bar graph format; see Figure 7-10.
Under 118.0 to 118.4 to 118.8 to 119.2 to 119.6 to 120.0 to 120.4 to 120.8 to 121.2 to 121.6 to Over
118.0 118.4 118.8 119.2 119.6 120.0 120.4 121.8 121.2 121.6 122.2 122.0
Figure 7-8. Histogram sampling-bins example.
Figure 7-9. Sample histogram.
Figure 7-10. Sample TIME-ON-TAP bar graph.
100
CL-6 SERIES CONTROL INSTALLATION, OPERATION, AND MAINTENANCE INSTRUCTIONS MN225016EN January 2016
 Loading...