MA-025 – DGA 900 Operator Guide – Rev 2.0 12-Apr-19 Page 21 of 92
A variety of trend charts are available to choose from — Historical, Thermal, Humidity, and
RTD Sensor. The default trend chart is an Historical Chart that plots selected gas readings
over time. Use the gas legend to identify the gas and the date selector control to change
the timeframe. Rest the pointer on any data point on a plot line to obtain a tooltip with a
timestamped gas value. Click a gas label on the legend to toggle the display of the plotted
gas on or off.
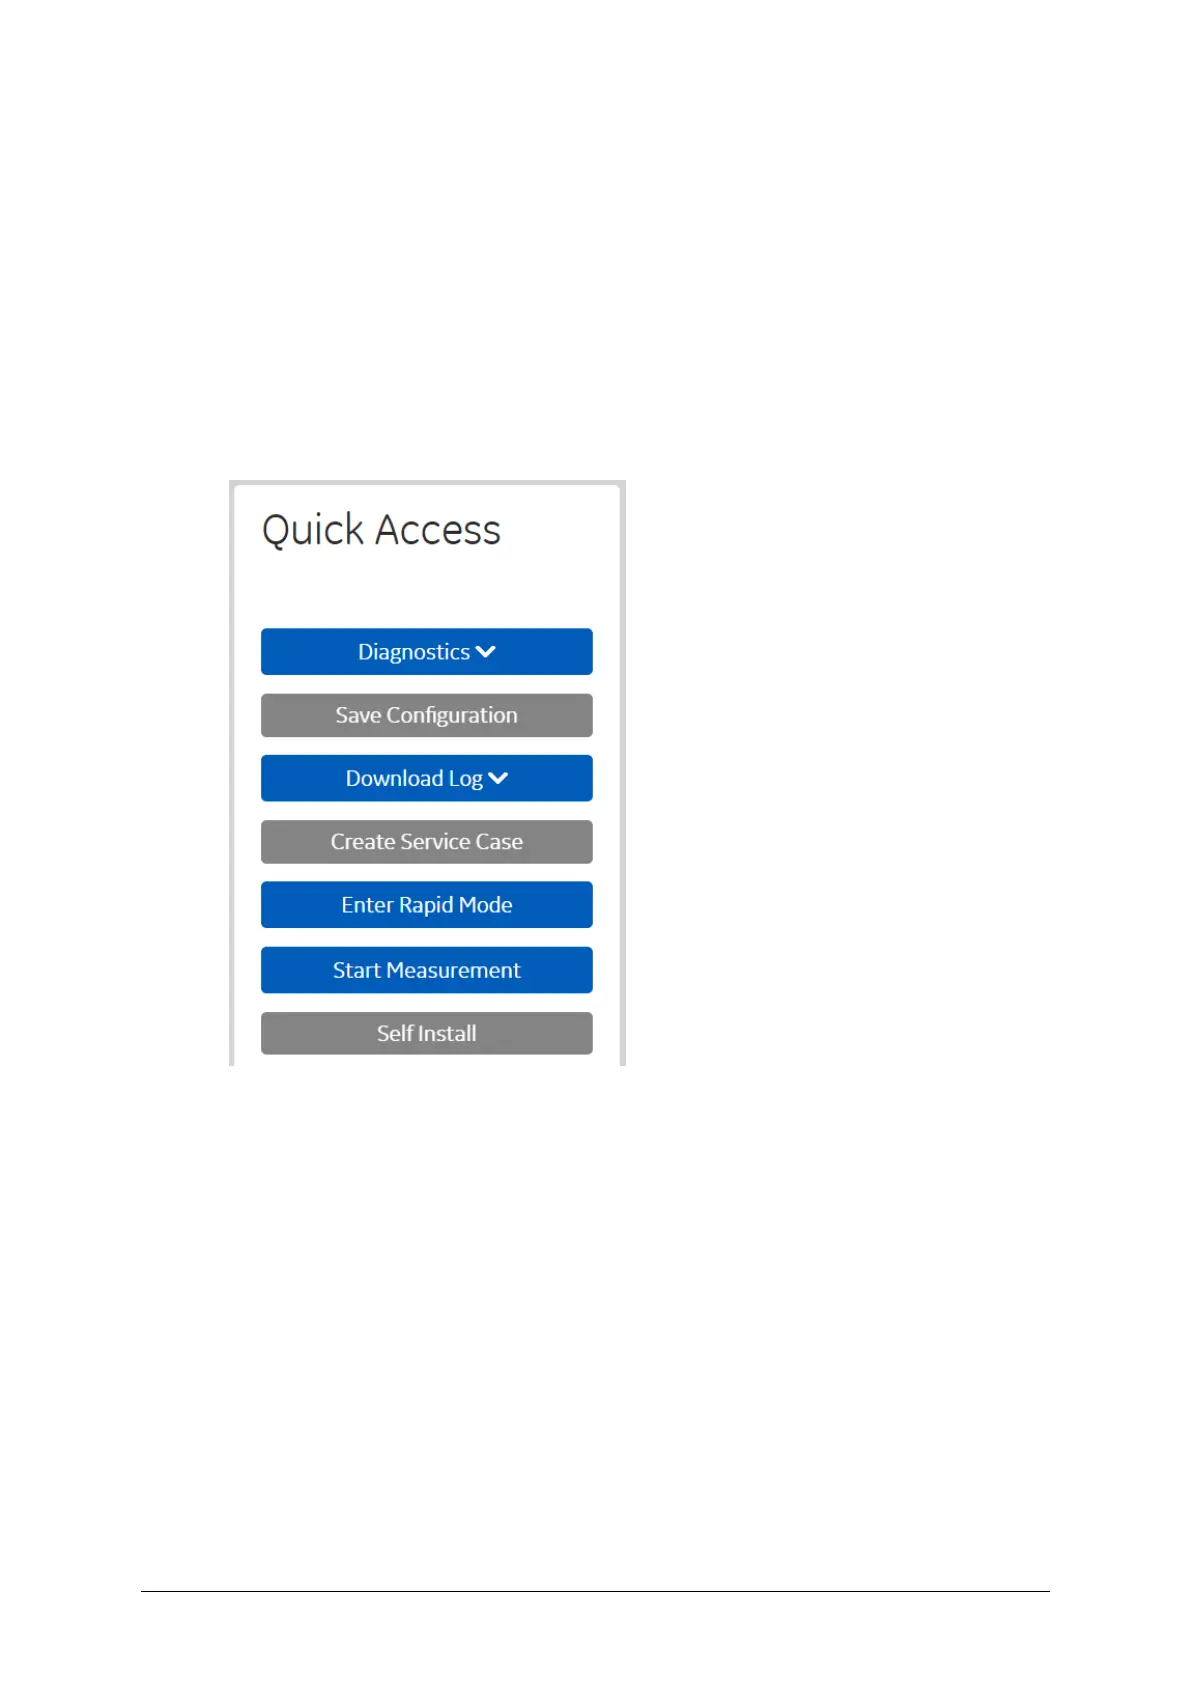
6.5.1 Quick Access
The Quick Access panel in the centre of the HMI as shown in Figure 6-6 offers additional
functionality. Note: Some features are disabled as they are still in development.
Figure 6-6: Quick Access
The following Quick Access features are available:
6.5.1.1 Diagnostics
Click Diagnostics to access the Duval Triangle or Gas Ratio diagnostics.
6.5.1.2 Download Log
Click Download Log to access the available log files. Choose from a System Log, TFD Log
and CFR Log. These service files contain product performance data that is used to check
product functionality. If requested, download and send the relevant log files to the GE M&D
Service Support team for analysis.
 Loading...