Model 333A/334A
100
100.5
102
112
100.5
102
112
Section
III
I
SECTION
111
OPERATING INSTRUCTIONS
3-1.
INTRODUCTION.
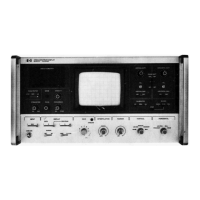
3-2. The Models 333A and 334A DistortionAnalyzers
measure
total
harmonic distortion
of
fundamentalfre-
quencies from 5
Hz
to
600
kHz;
harmonics upto 3
MHc
are included. The sharp elimination characteristics
(
>80
dB),
the low level of instrument induced
dtstor-
tion, and the meter accuracy
of
these instrumentsre-
sult
in
highly accurate measurement of low level har-
monic distortion.
3-3.
An
rms
calibrated voltmeter
is
inherent in the
333A and
334A.
The voltmeter provides
a
full
scale
sensitivity
of
300
p
volts rms (residual noise
<25p
volts).
The voltmeter frequency range
is
from 5
HZ
to 3 MHz
except on the 0.0003 volt range, which
is
from 20
Hz
to 500
kHz.
3-4.
CONTROLS AND INDICATORS.
3-5. Figure 3-1
illustrates
anddescribesthefunction
of
all
front
and
rear
panel
controls, connectors, and
indicators.
keyed to the drawing included within the
figure,
The description
of
each component
is
3-6.GENERAL OPERATING INFORMATION.
3-7.
INPUT
CONNECTIONS.
3-8. The
input
signal
can
be
connected to the 333A
and 334A through twisted pair
leads
or
a
shieldedcable
with banana plug connectors. Keep
all
test
leads
as
short
as
possible to avoid extraneous pickup from
stray
ac
fields. When measuring Low-level
signals,
ground loope may occur causing erroneous readings.
Ground loops may
be
avoided
by
connecting the 333A/
334A Distortion Analyzer to an appropriate isolation
transformer to break the chassis ground from power
supply ground. Connect
all
other
instruments
to one
power
strip
with the three-prong connectors
as
close
as
possible.
3-9. VOLTMETER CHARACTERISTICS.
3-10. The RMS VOLTS markmgs on the meter face
are based on the ratio between the average and effective
(rms) values
of
a
pure
sine
wave, The ratio of average
to effective values in a true sine wave
is
approximately
0.9
to
1.
When the meter
is
used to measure complex
waves,
the voltage indicated may not
be
the rms value
of the
signal
applied. This deviation
of
meter indica-
tion exists because the ratios of average to effective
values are usually not the same in
a
complex wave
as
in
a
sine wave. The amount of deviation depends on
the magnitude and
phase relation betweenthe harmonics
and fundamental frequency of the signal applied.
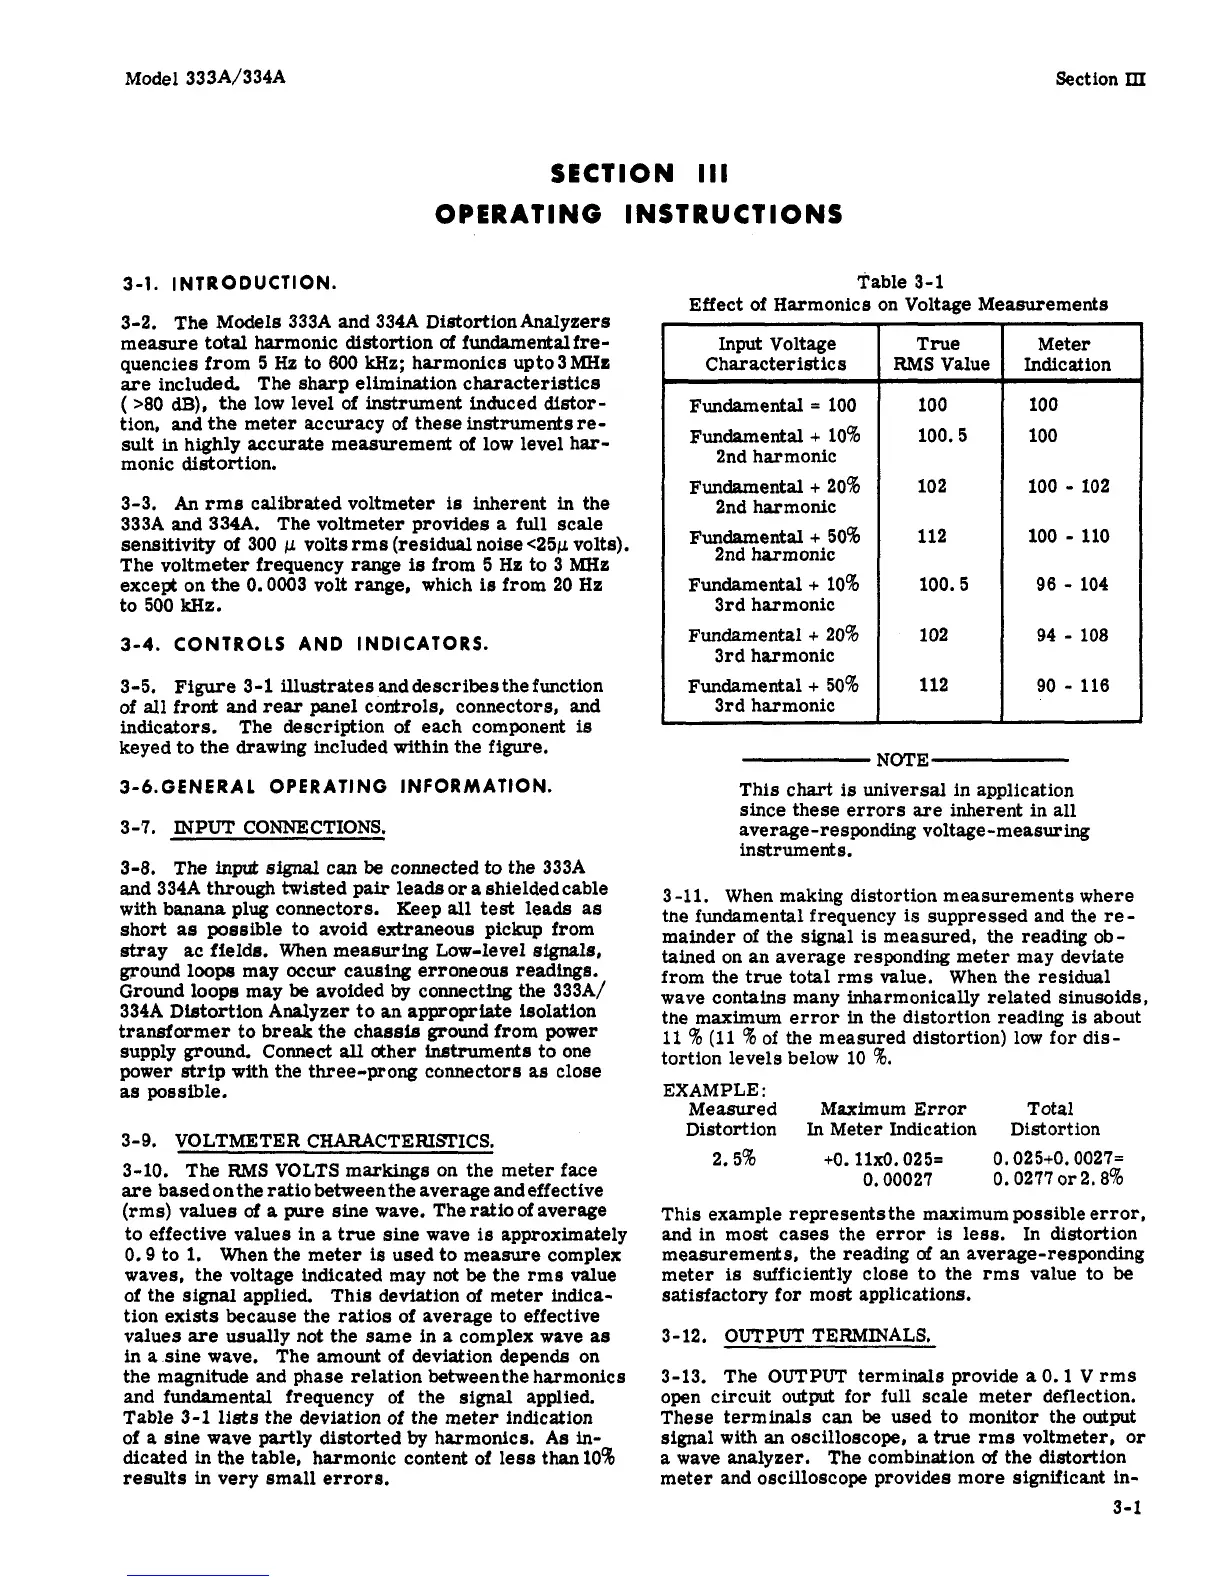
Table 3-1
lists
the deviation of the meter indication
of
a
sine wave
partly
distorted
by
harmonics.
As
in-
dicated in the table, harmonic content of less than
108
results
in
very small errors.
Table
3-1
Effect of Harmonics on Voltage Measurements
Input Voltage
Characteristics
Fundamental
=
100
Fundamental
+
10%
2nd harmonic
Fundamental
+
20%
2nd harmonic
Fundamental
+
50%
2nd harmonic
Fundamental
+
10%
3rd harmonic
Fundamental
+
208
3rd harmonic
Fundamental
+
50%
3rd harmonic
Meter
100
100
100
-
102
100
-
110
96
-
104
94
-
108
90
-
116
NOTE
This chart
is
universal in application
since these errors are inherent in
all
average-responding voltage-measuring
instruments.
3
-11.
When making distortion measurements where
tne fundamental frequency
is
suppressed and the re
-
mainder of the
signal
is
measured, the reading ob-
tained on an average responding meter may deviate
from the true total rms value. When the residual
wave contains many inharmonically related sinusoids,
the maximum error
in
the distortion reading
is
about
11
%
(11
%
of the measured distortion) low for dis-
tortion levels below 10
%.
EXAMPLE
:
Measured Maximum Error Total
Distortion In Meter Indication Distortion
2.5%
+O.
llx0.025= 0.025+0.0027=
0.00027 0.0277
or
2.8%
This example represents the maximum possible
error,
and in most cases the error
is
less. In distortion
measurements, the reading
of
an
average-responding
meter
is
sufficiently close to the rms value to
be
satisfactory for most applications.
3-12.
OUTPUT
TERMINALS.
3-13. The
OUTPUT
terminals provide
a
0.1
V
rms
open circuit
output
for
full
scale meter deflection.
These terminals can
be
used to monitor the output
signal
with
an
oscilloscope,
a
true rms voltmeter,
or
a wave analyzer. The combination
of
the distortion
meter and oscilloscope provides more significant in-
3-1
 Loading...