General Operating Information 2
Keysight U2020 X-Series User’s Guide 47
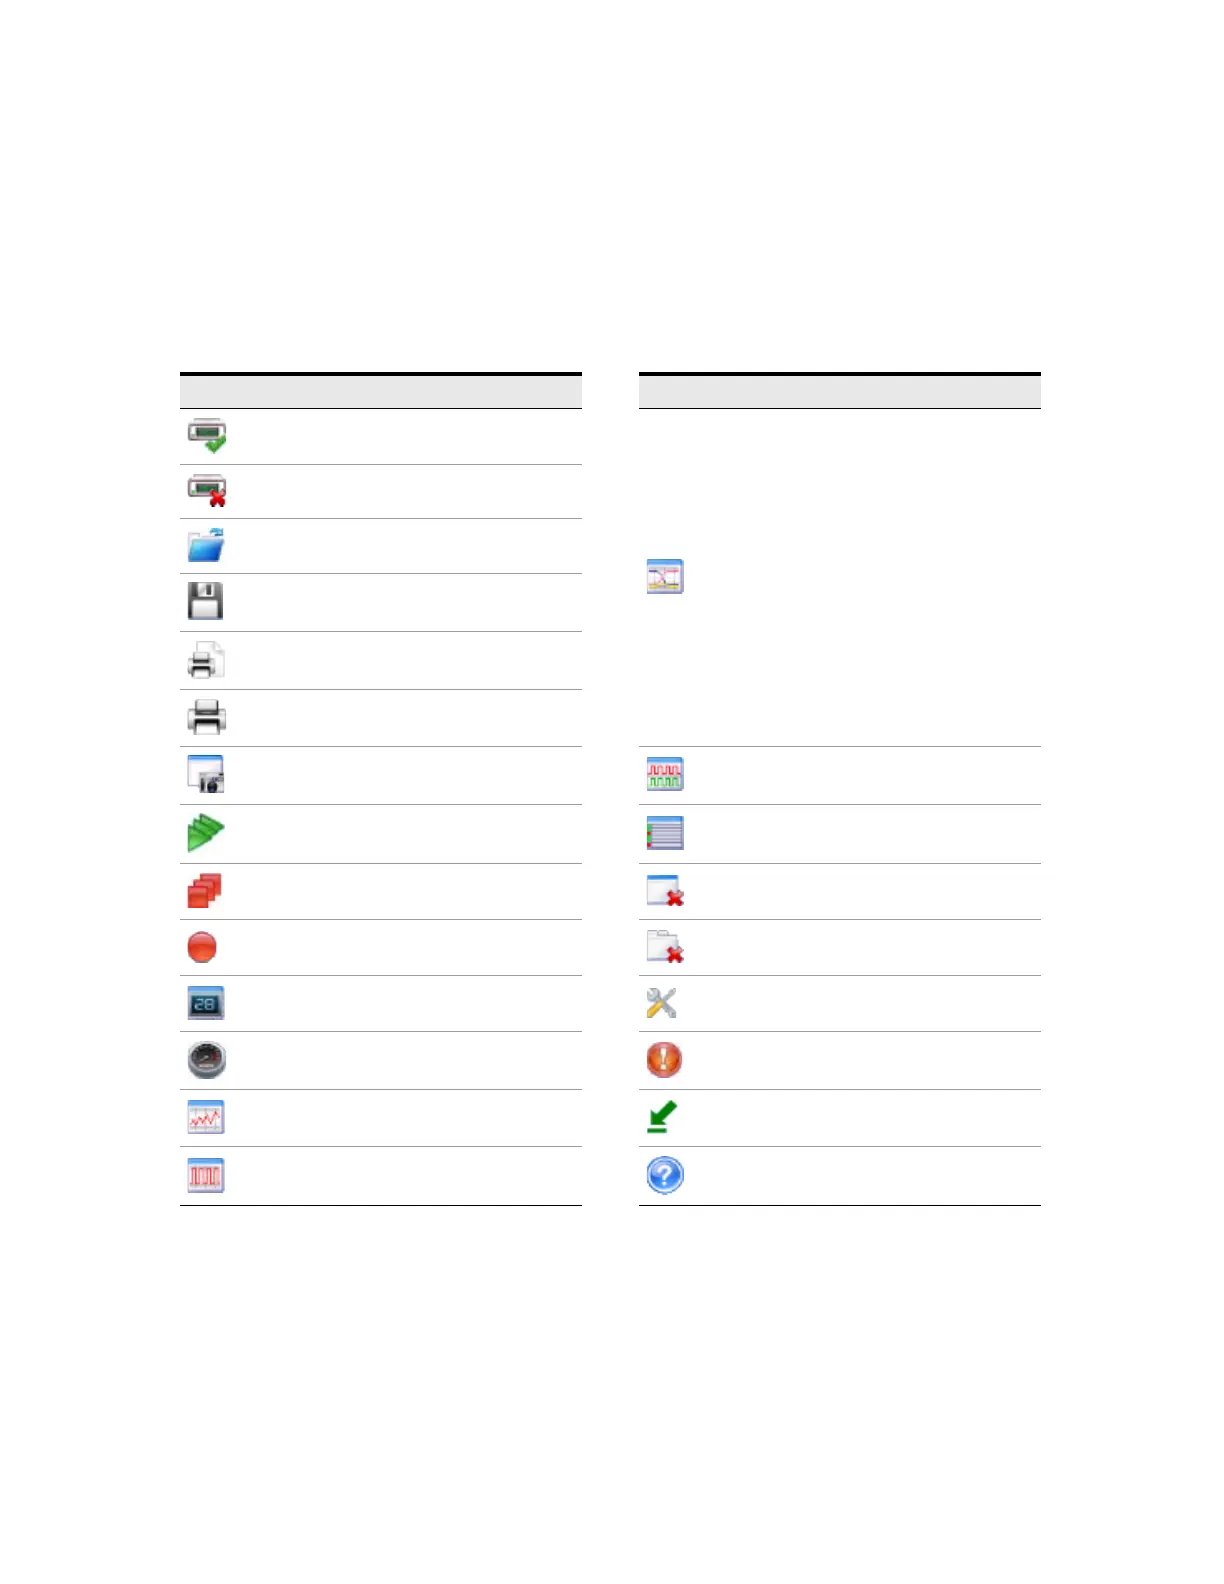
Main Toolbar Functions
Icon Function Icon Function
Connect to the U2020 X-Series.
Create a new Complementary Cumulative
Distribution Function (CCDF) graph display view
or a new gated CCDF graph display view
[a]
.
CCDF curves characterize the higher level power
statistics of a digitally modulated signal, and are
defined by how much time the waveform spends
at or above a given power level.
CCDF is applicable in the free-run, internal
trigger, and external trigger modes.
Gated CCDF is applicable in the internal trigger
and external trigger modes only.
You can view traces for Channel A, Gaussian, and
Reference.
Disconnect the U2020 X-Series.
Open any CSV-supported files.
Save measurement data as a CSV-supported file.
Preview a screenshot of the application prior to
printing.
Print a screenshot of the application.
Save a screenshot of the application as an image
file.
Create a new overlay graph display view
[a]
.
Start the acquisition of all measurements on
created tabs/views.
Create a multilist display view
[a]
.
Stop the acquisition of all measurements on
created tabs/views.
Remove the currently selected view from the
application.
Record and save measurement data in a
CSV-supported file.
Remove the currently selected tab (including the
views in the tab).
Create a new soft panel display view
[a]
.
Provide application options and settings
configuration.
Create a new gauge display view
[a]
.
Display the alert summary dialog.
Create a new strip chart display view
[a]
.
Switch between compact mode and full mode
display.
Create a new trace graph display view
[a]
.
Provide quick access to the help documentation.
[a] When this icon is selected, corresponding function icons will appear on the toolbar. Refer to the Power Analyzer help documentation for
details.
 Loading...