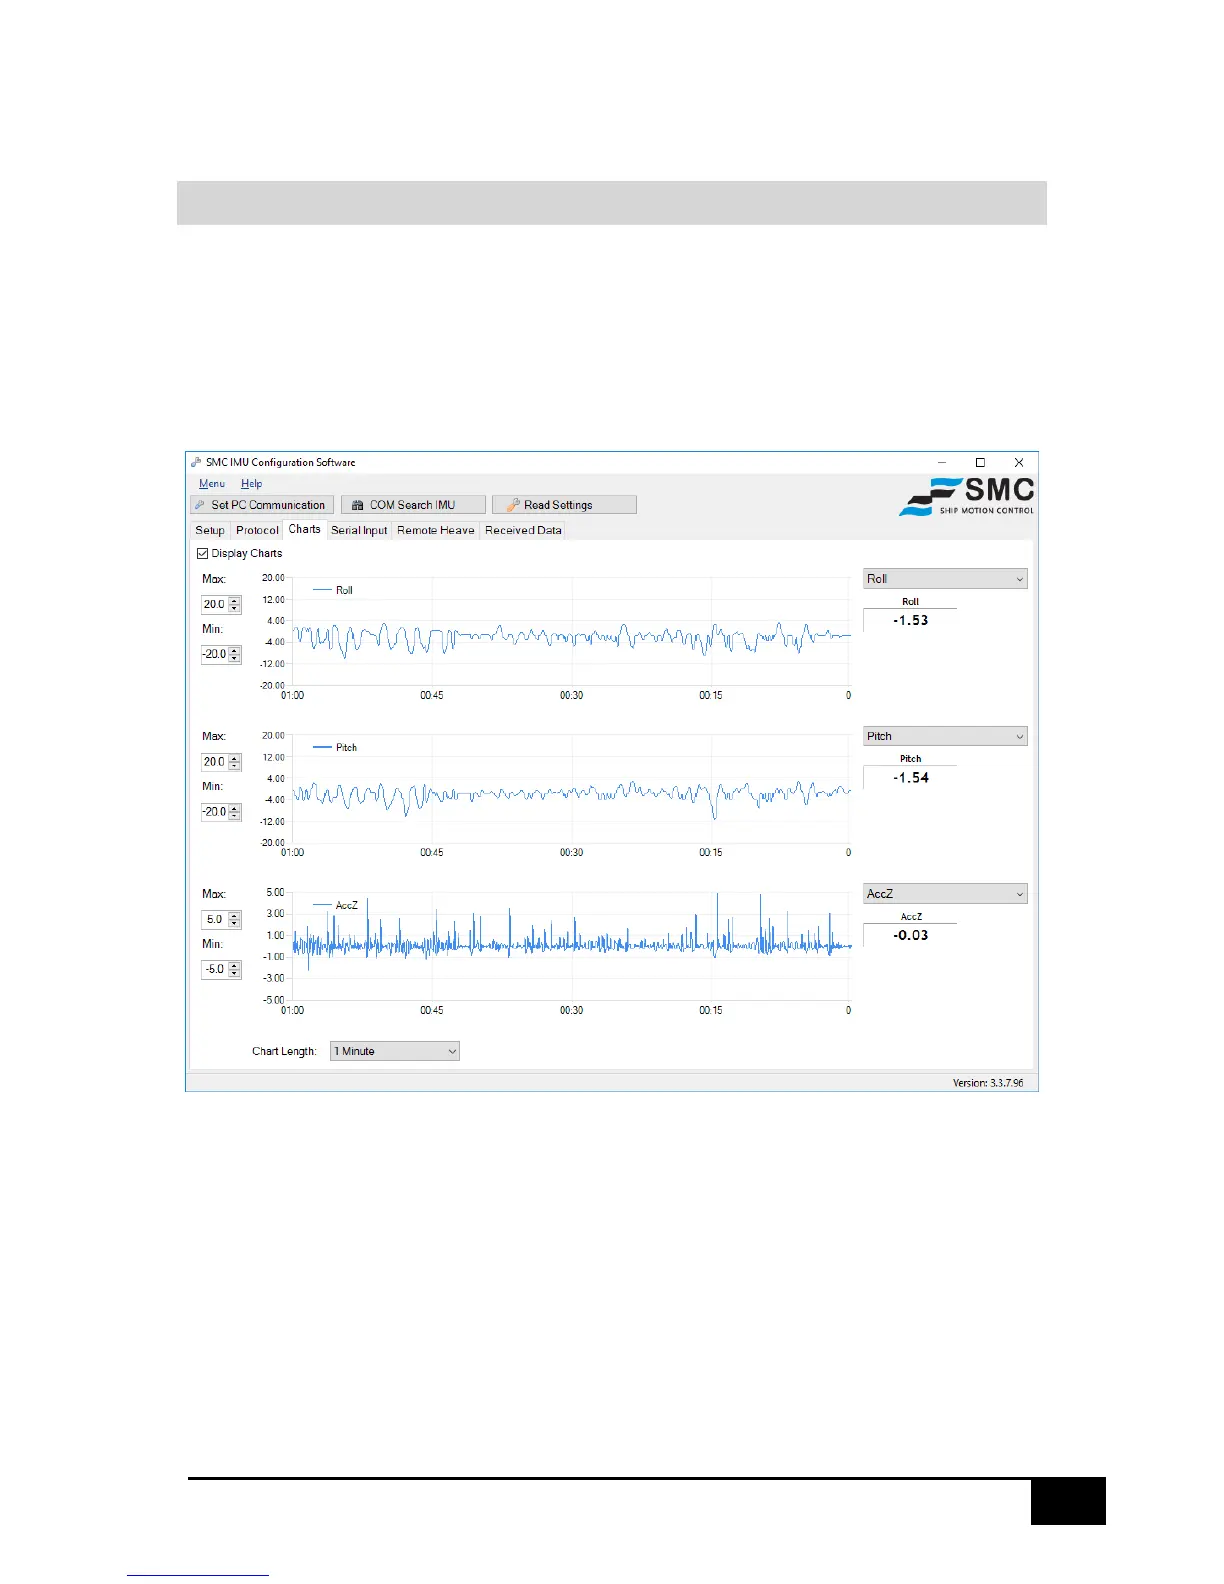
4.7 CHARTS
As a visual aid to or as a simple motion monitoring system, SMC have a Chart screen that displays up
to 3 parameters in a graphical representation.
After selecting the Charts tab tick the Display Charts tick box to activate the data display.
Beside each chart is a drop-down menu from where the parameter to be displayed can be selected.
The chart scale is set on the left of the screen with a Maximum and Minimum setting. The chart
length is set for all the charts from the drop-down menu at the bottom of the screen.
 Loading...