Display a wavefo
rm
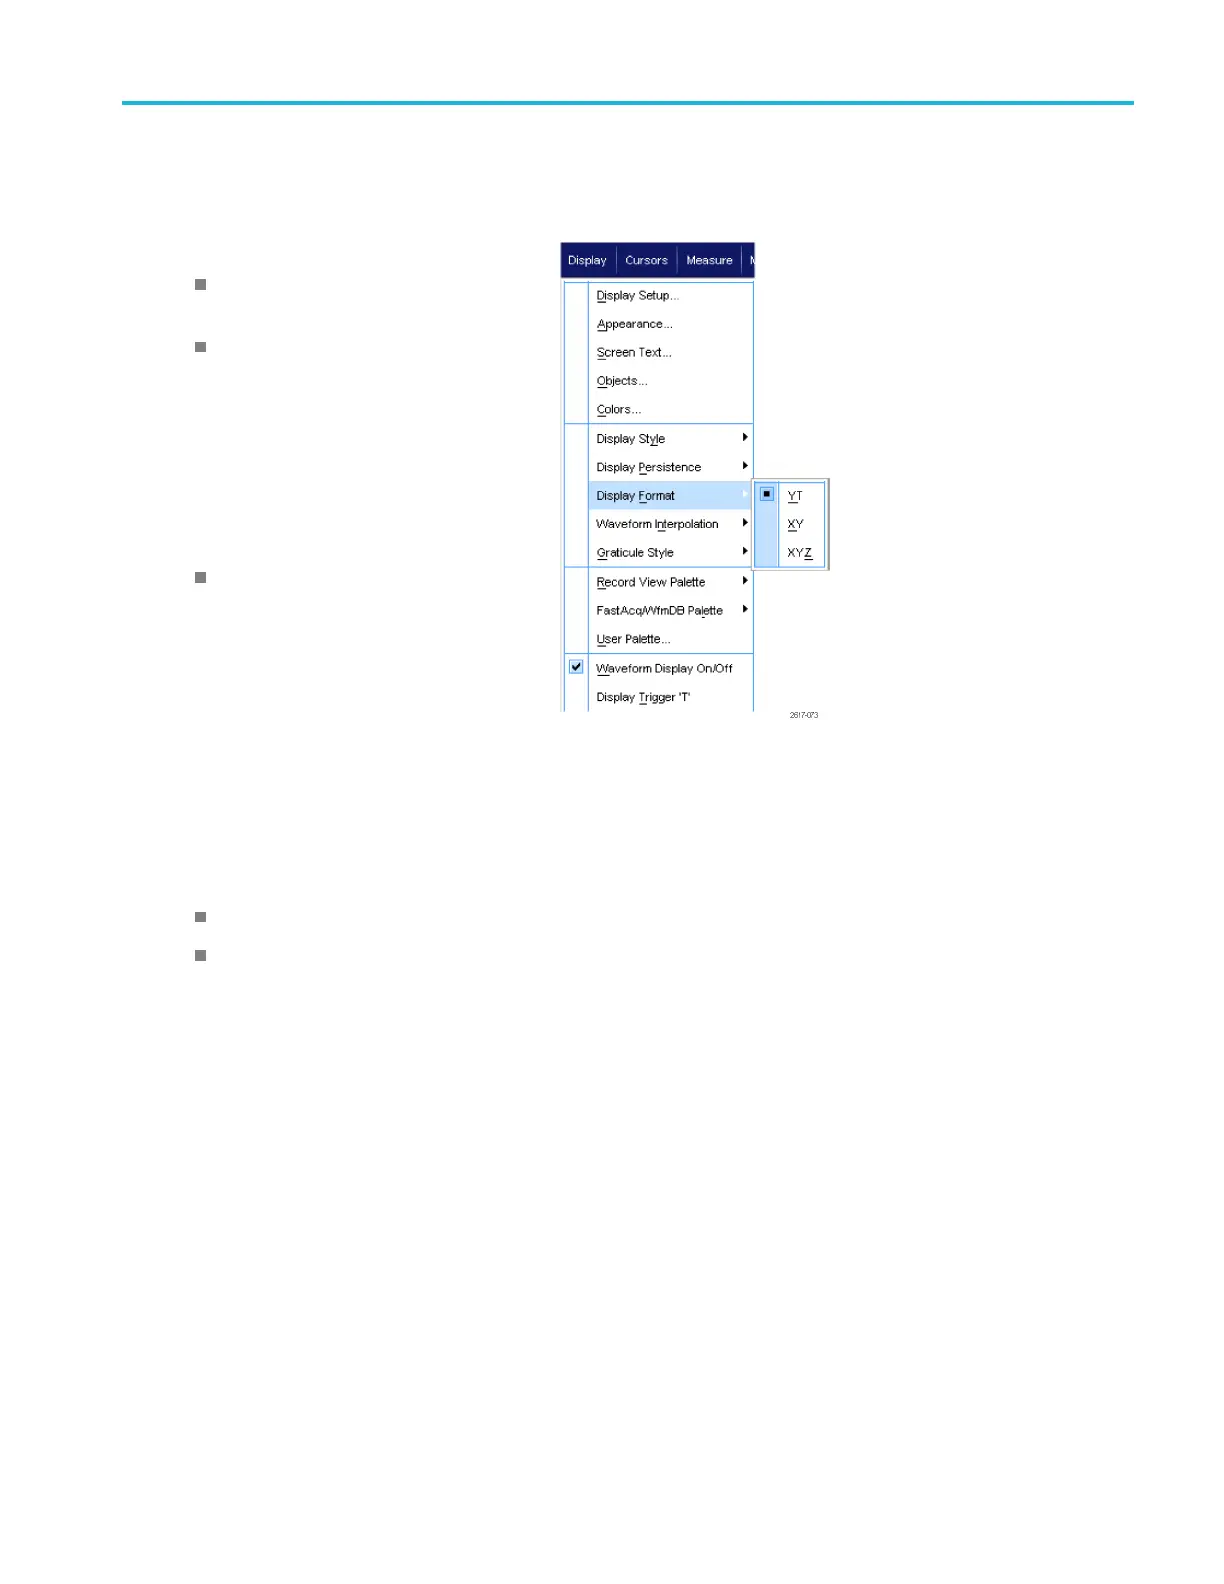
Setting the Display Form at
The instrument can display waveforms in two different formats. Choose the format that best suits your needs.
Select Display > Display Format.
Select YT format to show a s ignal
amplitude as it varies over time.
Select XY format to compare the
amplitude of waveform records point by
point:
The following channels are compared:
Ch 1 (X) and Ch 2 (Y),
Ch 3 (X) and Ch 4 (Y),
Ref 1 (X) and Ref 2 (Y),
Ref3(X)andRef4(Y)
Select XYZ format to compare the
voltage levels of the Ch 1 (X) and Ch 2
(Y) w aveform records point by point as
in X Y format. The displayed waveform
intensity is modulated by the Ch 3
(Z) waveform record. XYZ format is
triggered. A -5 division signal (including
position and offset) on Ch 3 produces
a blank screen; a +5 division signal
produces full intensity.
Quick tips
XY format is particularly useful for studying phase relationships such as Lissajous Patterns.
XY format is a dot-only display, although it can have persist ence. The Vector style selection has no effect when you
selec
tXYformat.
MSO/DPO70000DX, MSO/DPO70000C, DPO7000C, and MSO/DPO5000B Series User Manual 93
 Loading...